RSS

Calgary Latest Real Estate Market Report – Rangeview SE (Q3 2025)

Rangeview continued its steady growth trajectory in Q3 2025, reflecting the area’s rising appeal as one of southeast Calgary’s most vibrant and family-friendly communities.

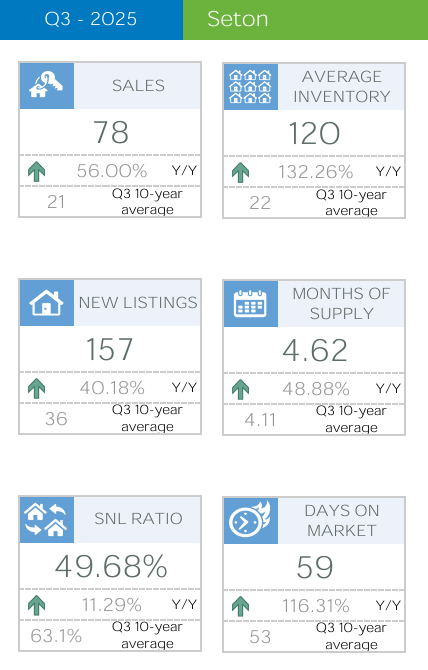
  • Total Sales: 38, representing a 100% year-over-year increase.

  • New Listings: 73, up 143% from the same quarter in 2024.

  • Sales-to-New Listings Ratio: 52.1%, indicating a balanced market.

  • Average Inventory: 53 units, up 169% year-over-year.

  • Months of Supply: 4.18, suggesting more selection for buyers compared to earlier quarters.

  • Average Days on Market: 50 days, slightly longer than last quarter as inventory expanded.

The median residential price settled at $637,950, showing a 1.1% annual decrease, while the average price was $656,954, down 4% year-over-year. Despite minor softening in prices, market activity remained strong across most property types.


Market Trends by Property Type

  • Detached Homes:

    • 28 sales, up 86.7% year-over-year.

    • Median price: $661,750, showing a 1.0% annual increase.

    • Average price: $683,312, down slightly by 3%.

    • Demand for detached homes remains high, supported by strong new home construction and family migration to Rangeview.

  • Semi-Detached Homes:

    • 7 sales, a 133% increase compared to last year.

    • Median price: $630,000, up 5% year-over-year, though the average price dipped slightly to $610,057.

    • Moderate inventory growth (up over 500%) provided more options, keeping the segment competitive.

  • Row Homes:

    • 3 sales, up 200% year-over-year.

    • Median price: $520,000, marking a 4.8% annual decline but still strong relative to other southeast communities.

    • Average price: $520,373, down 4.7%, consistent with a shift toward more affordable attached housing.


Community Development & Features

Rangeview continues to evolve as a vibrant “agrihood”—a first-of-its-kind community in Calgary designed around urban agriculture, sustainability, and wellness.

  • Community Gardens & Greenhouses: Residents enjoy access to shared gardens, greenhouse facilities, and seasonal markets, encouraging a strong sense of local connection.

  • Walkable Design: The community features pedestrian-friendly streets, playgrounds, and future retail zones, designed for family living.

  • Proximity to Seton Urban District: Just minutes away from Seton Shopping Centre, Cineplex VIP Cinemas, and numerous restaurants, providing all urban conveniences.

  • Access to South Health Campus: Rangeview is located near the South Health Campus, Calgary’s leading medical facility offering:

    • 24/7 emergency and trauma care

    • Specialized medical services including cardiac, orthopedic, and oncology care

    • Wellness, physiotherapy, and outpatient clinics

    • Research and teaching programs affiliated with the University of Calgary


With expanding housing diversity, rising infrastructure investment, and sustainable community planning, Rangeview is positioned for long-term growth. While price adjustments are moderating short-term gains, buyer demand remains robust, especially among young families and professionals drawn to the area’s modern amenities and proximity to healthcare and retail hubs.

Contact us for a Free Home Evaluation.

Read

🏙 Calgary Real Estate Market Update - Seton Q3 2025

Q3 2025 activity in Seton remains strong versus its 10-year average (only 21 quarterly sales historically). Inventory growth and slightly longer selling times show the market cooling from 2023-24 highs, but buyer demand continues thanks to Seton’s live-work-shop convenience.

MetricQ3 2025 ValueY/Y Change
Sales78+56 %
New Listings157+40 %
Sales/New Listings Ratio49.7 %Balanced market
Average Inventory120+132 %
Months of Supply4.62+49 %
Average Days on Market59+116 %
Benchmark Price$472,400▼ 2.1 %
Median Price$431,337▼ 1.7 %
Average Price$459,129▼ 4.1 %

Market Trends by Property Type

Detached Homes

  • Benchmark Price: $753,033 (▼ 2.7 % Y/Y)

  • Median Price: $705,450 (▼ 7.2 %)

  • Average Price: $709,356 (▼ 6.5 %)

  • Average DOM: 76 days
    Detached remains the premium segment. Price softening reflects higher inventory (6.4 months of supply), but demand persists for newer 2020-built two-storey homes averaging 1,786 sq ft

Semi-Detached Homes

  • Benchmark Price: $583,500 (▼ 1.6 %)

  • Median Price: $598,000 (+ 2.3 %)

  • Average Price: $584,500 ( no change )
    Balanced conditions; affordability attracts young families and move-up buyers. Semi-detached units average 1,128 sq ft above grade, built 2019-2020.

Row Townhomes

  • Benchmark Price: $470,733 (▼ 1.0 %)

  • Median Price: $442,000 (▼ 9.7 %)
    Townhome supply rose, creating more buyer choice. This segment remains the entry point for homeowners seeking attached living close to amenities.

Apartments

  • Benchmark Price: $362,467 (▼ 4.4 %)

  • Median Price: $340,000 (▼ 9.3 %)
    Condo demand stays solid thanks to affordability, though price corrections reflect rising inventory. Many units are modern 2-bedroom suites (~883 sq ft) built 2019.


Price Bands & Market Balance

Most Q3 2025 transactions occurred between $400K – $699K.
Apartments dominate the lower brackets (< $400K), while detached homes anchor $700K – $900K.
Sales-to-new-listings ratio ≈ 50 % and 4.6 months of supply = balanced market—neither strongly buyer nor seller-favoured.


🏘 Community News & Events (Fall 2025)

Seton Urban District Expansion
Construction continues on the Seton South Urban Centre, adding new retail, dining, and residential spaces by mid-2026.

Brookfield Residential Community Events

  • Seton Night Market (Fall Series) – Local vendors, live music at Seton Urban District Plaza.

  • Halloween in the Square – Family-friendly trick-or-treat and pumpkin walk.

  • Seton Wellness Week – Partnership with South Health Campus offering free fitness and nutrition seminars.

Transportation & Infrastructure

  • Calgary Transit Green Line Stage 1 construction progresses north of Seton, expected to connect to the community by 2027.

  • Improved access to Deerfoot Trail and Stoney Trail has reduced commute times to downtown.


🏫 Schools Serving Seton

Public Schools

  • Joane Cardinal-Schubert High School (gr. 10-12) — located within Seton.

  • Cranston School (K-6) and Dr. George Stanley School (5-9) serve adjacent areas until a dedicated Seton K-9 school opens.

Catholic Schools

  • Our Lady of the Rosary School (K-6) – Cranston.

  • All Saints High School (gr. 10-12) – Seton.


Seton’s Q3 2025 figures show a healthy, balanced market:

  • Prices have moderated after rapid pandemic-era growth.

  • Inventory expansion is creating opportunities for first-time buyers and investors.

  • Ongoing commercial and infrastructure growth keeps Seton one of Calgary’s fastest-developing urban centres.

Contact us for a Free Home Evaluation.

Read

卡尔加里最新房地产市场报告:9月份供给增加,推库上升,价位调整

卡尔加里9月份的二手民宅一共卖掉1,720套,不足以抵消市场上新增的3,782个挂牌,推动库存在秋季继续上升。9月份库存总量达到6,916套,比去年同期高出36%,也比历年9月通常水平高出17%以上。联屋和公寓类住宅的供应量相比长期趋势增幅最大。

二手房、新房和租赁市场的供应水平均在上升。增加的供给选择整好出现在买家需求放缓的时期,主要由于人口增长放缓和持续的不确定性。二手房市场面临来自新房和租赁市场新增供应的更多竞争,降低了潜在买家的紧迫感。最终,增加的供给房源给价位上涨形成压力。‍

通常,供需关系的变化会推动房价的波动。9月份,销售与新增挂牌比率下降至45%,库存月数首次自2020年初以来升至4个月。这一水平的供应相对于需求高于卡尔加里市场通常的状况,如果持续下去,市场可能会逐渐向买方倾斜。不过,具体情况仍因房产类型、价格区间和地段而异。‍

过去几个月,公寓类住宅的库存增加,推动该细分市场进入买方市场状态,导致房价同比下调超过6%,9月份的市场基准价为$322,900。虽然独立屋板块的库存月数也有所上升,但幅度不及公寓市场。在$749,900的市场基准价下,独立屋价格仅比去年下降1%,且大部分调整主要集中在东北区和北区。

独立屋(Detached)

9月份独立屋销售放缓至859套,比去年下降9%,并低于9月的长期趋势。同时,新挂牌上升至1,905套,使销售与新挂牌比率降至45%,这一水平自2018年以来未曾出现。尽管9月份市场出现了意外变化,但尚难判断这一趋势是否会持续,因为在此之前,独立屋市场整体仍保持相对平衡。

随着供应选择的增加,价格相较于春季创下的历史高点有所下降。9月份的市场基准价为$749,900,环比和同比均下降近1%。虽然各区域价格均从峰值回落,但降幅最大的为东北区和东区,超过6%。尽管近期有所调整,但年初至今的价格仍较去年高出近2%,其中市中心涨幅最高,超过4%。


半独立屋(Semi-Detached)

月份新挂牌上升至361套,而销售下降至156套,使销售与新挂牌比率降至43%。这也推动库存增加,供应月数接近4个月,相比上月不到3个月的水平出现明显上升。

与独立屋类似,目前仍难以判断这一趋势是否会延续,但迄今对房价影响不大。9月份半独立屋价格为$684,800,略低于上月,较去年高出近1%。年初至今,半独立屋价格增幅最高,超过3%,因为该板块从卖方市场转向更平衡状态的时间更长。大部分价格增长来自市中心的带动。


排屋(Row/Townhouses)

继上月回落后,9月份新挂牌小幅增长。592笔新挂牌对应304笔销售,使销售与新挂牌比率降至51%。虽然比其他物业类型略高,但这一水平足以阻止已经偏高的库存进一步增长。9月份库存为1,099套,是自2018年以来最高的9月水平,比该月长期趋势高出30%。库存增长最多的为东北区,该区的供应月数最高,价格同比降幅也最大。

更多的供给影响了成交价格,9月份的市场基准价为$437,100,环比下降不足1%,同比下降近5%。年初至今的价格调整幅度较小,仅1%,主要因为东北、北部和东南区的降幅抵消了其他区域的涨幅。


共管公寓(Apartments)

市场中最显著的调整出现在公寓板块。随着租赁供应增加、利率调整延后以及其他物业类型选择的改善,首次购房者和投资者对公寓的需求有所放缓。9月份成交401笔,新挂牌924笔,使销售与新挂牌比率降至43%,库存增加至1,999套。

供应增加推动供应月数升至5个月,这是自2021年以来首次出现。由于自6月以来供应持续偏高,价格呈下行趋势。9月份的市场基准价为$322,900,环比下降逾1%,同比下降超过6%。年初至今的价格调整幅度略高于1%。与去年同期相比,各区公寓价格均出现下滑,东北区降幅最大,超过10%;市中心降幅最小,为5%。

卡尔加里周边城镇

Airdrie

9月份新挂牌达到295套,创下历年同期新高。但销售回落,使销售与新挂牌比率降至45%,库存增加至571套。今年以来库存整体呈上升趋势,而这是自2020年以来供应月数首次超过4个月。更多的供应选择对房价形成压力,本月价格继续下行。9月份的市场基准价为$526,000,较上月下降1%,较去年下降近5%。尽管近期有所回调,但年初至今价格仅下降约1%,不足以抵消去年8%的年度增长。


Cochrane

9月份的新挂牌同样创下同期新高,达到148套。虽然62笔销售与去年持平,但新增挂牌的大幅增加使销售与新挂牌比率降至42%,推动库存进一步上升,供应月数突破5个月。供应水平的改善也缓解了房价压力。9月份的市场基准价为$584,300,环比下降近1%,但仍比去年同期高出1%。由于供应调整主要是近期才出现,年初至今的基准价仍比去年高出近4%。


Okotoks

这是少数几个9月份未见新挂牌增长的主要区域之一。69笔新挂牌低于去年的水平,而本月销售为51笔,使销售与新挂牌比率保持在74%的高位。库存水平仅较上月略高,供应月数仍维持在约2.5个月的低位。尽管市场相对紧张,但价格仍在调整,这部分与新房竞争影响转售价格有关。9月份整体住宅基准价为$613,900,环比下降逾1%,同比下降近3%。不过,年初至今的价格仍比去年高出1.5%。

-Jesus loves you-
-Invite God Into Your Situation-

更多信息,请看链接

Read

The latest Calgary Elementary Schools Ranking
  • Publication Date & Scope: The Fraser Institute's 2024 "Report Card on Alberta’s Elementary Schools" was released in 2024, covering 730 schools across public, separate, independent, and charter systems

  • Improvement Spotlight — Banff Elementary: Among the most notable stories of improvement, Banff Elementary School (public) rose from a score of 6.1 in 2017 to an impressive 9 in 2023


Calgary’s Top Performers in 2022–23 (per available data)

While the 2024 public release didn’t outline Calgary’s full ranking list, earlier data (2022–23) offers insights into top schools in Calgary:

  • Clear Water, Master’s, Renert, and Webber all achieved a perfect 10/10 rating and are tied for 1st place among all of Alberta

  • Other high performers include:

    • Calgary French & International — 9.8 (rank 5)

    • Holy Name, Sunalta — 9.6 (rank 9)

    • Louis Pasteur, Rundle College — 9.4 (rank 13)

    • St. Joan of Arc — 9.3 (rank 16)

These top-caliber schools are clustered among both public and private institutions.


FFCA Charter Schools — 2025 Update

  • The Foundation for the Future Charter Academy (FFCA), which includes six combined elementary-middle campuses, achieved an overall provincial rank of 28 out of 858 elementary-level schools, placing them in the 97th percentile. This marks their highest-ever ranking to date.


A Balanced View

It’s worth noting that the Alberta Teachers Association (ATA) and certain school divisions have criticized the Fraser Institute’s methodology. They argue that the rankings:

  • Rely heavily on Provincial Achievement Test (PAT) results.

  • Do not account for socioeconomic context, student diversity, special needs, and broader school qualities 


What Parents Should Consider

Rankings offer useful starting points but shouldn’t drive decisions alone. Consider:

  • Visiting schools in person.

  • Talking to administrators and teachers.

  • Reviewing programs beyond test scores.

  • Assessing school atmosphere, values, and fit with your child’s needs.

Read

AUGUST 2025 HOUSING MARKET UPDATE

Price declines mostly driven by higher density home types

Improving supply choice has changed the dynamics of the Calgary market driving price declines over the past several months. Higher price adjustments are occurring for apartment and row style properties while detached and semi-detached properties have reported modest declines. As of August, the unadjusted total residential benchmark price was $577,200, down over last month and nearly four per cent lower than levels reported last year.

“Perspective is needed when it comes to price adjustments. The most significant price adjustments are occurring for row and apartment style homes as they are also the product type that are facing the largest gains in supply choice,” said Ann-Marie Lurie, Chief Economist at CREB®. “Meanwhile price adjustments in the detached and semi-detached markets range from modest price growth in some areas to larger price declines in areas with large supply growth. Overall, recent price adjustments have not offset all the gains that have occurred over the past several years.”

August reported 1,989 sales, nearly nine per cent lower than last year. Sales have slowed compared to the high levels reported over the past four years. However, activity is still above long-term trends, reflecting relatively strong demand. What has changed is the supply situation. New listings remain elevated, keeping the sales-to-new-listings ratio below 60 per cent and pushing inventory to 6,661, the highest August amount since 2019. 

More inventory choice coupled with lower sales has caused the months of supply to rise to 3.4 months in August, much higher than the sellers' market conditions reported over the previous four years, but still well below the buyer market conditions observed prior to the pandemic. While the market is much more balanced compared to last year, there is significant variation depending on property type, price range and location.   

Detached

Detached home sales eased to 995 units in August, while new listings rose to 1,748 units, keeping the sales-to-new listings ratio below 60 per cent. This prevented any significant shift in inventory, as the 3,051 units were the highest levels reported in August since 2020. Higher inventory levels and easing supply have helped balance out the detached market. However, districts like the North East, North and East are experiencing buyer market conditions.   
  
The unadjusted benchmark price in August was $755,600 down by nearly one per cent over last month and last year's levels. While prices have eased there is significant variation depending on location. Compared to last year, prices reported the largest decline in the North East and East district at five per cent, while prices in the city centre were over two per cent higher. As many of the adjustments have occurred over the past few months, year-to-date Calgary prices remain two per cent higher than last year.
 

Semi-Detached

August sales improved over last year’s levels, but it was not enough to offset earlier pullbacks with year-to-date sales of 1,557—eight per cent lower than last year—but higher than long-term trends. At the same time, new listings slowed compared to sales pushing the sales-to-new listings ratio up to 67 per cent and preventing any further monthly inventory gains. Inventory gains have not been as high for this product type, and the months of supply remained below three months in August. This is one of the reasons that the prices have not seen the same adjustment.
 
In August the unadjusted benchmark price was $687,200 down over last month, but nearly one per cent higher than last year, and nearly four per cent higher on a year-to-date basis. Price growth has varied across the city, with the largest year-over-year gains occurring in city centre. Meanwhile the largest declines have occurred in the North East, East and North districts.
 

Row

Sales in August slowed, contributing to the year-to-date decline of nearly 16 per cent. While new listings did ease in August compared to last year and last month, they have generally been on the rise pushing up inventory levels. In August, there were 1,103 units in inventory, reaching the second highest level on record for August, only slightly lower than the record high in reported in 2018. Due to the relatively strong sales, the months of supply has only pushed slightly above three months, far more balanced than last year, but not as high as the 6.4 months report back in 2018.
 
Nonetheless, additional supply choice has weighed on prices. In August, the unadjusted benchmark price in the city was $439,600, reflecting the fourth consecutive monthly decline and nearly five per cent lower than last August. While prices eased across all districts, price declines exceeded five per cent in the North East, North, South and East districts. These districts generally reported high levels of supply in the resale sector or had significant competition from new home supply.


Apartment Condominium

Sales continue to slow in August contributing to a year-to-date pullback of nearly 30 per cent. While sales are still above long-term trends, they have not been high enough to offset the level of new listings in the market. In August alone there were 877 new listings compared to the 449 sales, keeping the sales-to-new-listings ratio relatively low at 51 per cent. The low ratio that has persisted throughout this year has contributed to the higher inventory levels seen in the market. While August inventory levels did not rise over last month, with 1,979 units available, this is the highest August inventory ever reported.
 
The months of supply for apartment condos have remained around four months since June. The excess supply relative to demand has been weighing on prices. As of August, the unadjusted benchmark price was $326,500, reflecting the fifth consecutive monthly decline and nearly six per cent lower than levels reported last August. Most of the supply is concentrated in the City Centre, which reported a year-over-year decline of five per cent, slightly higher than the rate of decline reported in the West district at three per cent. Meanwhile, the highest price declines occurred in the North East district at over 11 per cent.


REGIONAL MARKET FACTS


Airdrie

Easing sales in August contributed the year-to-date decline of 12 per cent for 1,248 sales so far this year. The 152 sales this month was met with 265 new listings, pushing the sales-to-new listings ratio up to 57 per cent and preventing any further monthly inventory gains. As of August, there was 535 units in inventory, above long-term trends and the highest levels reported since before the pandemic. The rise in supply has helped shift the market to more balanced conditions. However, with more supply options in both the new home, resale markets and in competing locations, there has been some downward pressure on prices in Airdrie. In August, the unadjusted total residential benchmark price was $531,100, down over last month and four per cent lower than levels reported last August.


Cochrane

The 70 sales this month were met with 139 new listings causing the sales-to-new listings ratio to fall to 50 per cent, the lowest ratio reported for August since 2015. The pullback in sales compared to new listings prevented any significant shift in inventory levels, pushed the months of supply up above four months. Despite the shift this month, prices in Cochrane remained relatively stable in August, with the unadjusted benchmark price sitting at $589,100, similar to last month and nearly two per cent higher than last year. On a year-to-date basis prices are four per cent higher than the previous year.


Okotoks

New listings in August reported a significant pullback relative to sales and the sales-to-new-listings ratio pushed up to 80 per cent. While sales have generally remained in line with long-term trends, new listings have not had the same increase that other areas have reported, preventing significant gains in inventory levels. As of August, there was 116 units in inventory, a 29 per cent gain over last year, but still 30 per cent lower than levels traditionally seen in August. Despite tighter conditions, prices have reported some monthly declines. However, year-to-date benchmark prices remained two per cent higher than last year’s levels, with gains reported across each property type.

Contact us for FREE HOME EVALUATION.

Read

Auburn Bay Calgary Latest Real Estate Market update (August 2025)

  • Sales: 43 (↑65% y/y)

  • New listings: 44 (↓12% y/y)

  • Active inventory (end of month): 85 (↑73% y/y)

  • Months of supply: 1.98 (tight but easing vs earlier this year)

  • Benchmark (Total Residential): $623,200.

By Property Type — What’s Moving

Detached

  • Sales: 21 (↑50% y/y)

  • New listings: 23

  • Inventory: 44

  • Months of supply: 2.11

  • Benchmark price: $805,900.
    Takeaway: healthy demand with balanced-leaning conditions.

Semi-Detached (Duplex)

  • Sales: 8 (↑300% y/y)

  • New listings: 4

  • Inventory: 2

  • Months of supply: 0.71

  • Benchmark price: $526,200.
    Takeaway: severe shortage—multiple-offer risk remains highest here.

Row/Townhouse

  • Sales: 3 (↓40% y/y)

  • New listings: 6

  • Inventory: 13

  • Months of supply: ~4.33

  • Benchmark price: $454,800.
    Takeaway: the softest segment right now; buyers have selection and leverage.

Apartment

  • Sales: 11 (↑120% y/y)

  • New listings: 11

  • Inventory: 26

  • Months of supply: 2.36

  • Benchmark price: $350,700.
    Takeaway: activity is up and conditions are reasonably tight for well-presented units.

Year-to-Date Context (Jan–Aug 2025)

  • Sales: 290 (↓15% vs 2024 YTD)

  • New listings: 467 (↑11% YTD)

  • Months of supply (avg): 2.24

  • YTD Benchmark (Total Residential): $629,400 (↓2% y/y).

What This Means (Actionable Insight)

  • Sellers:

    • Semi-detached: price assertively and prep for multiple offers; speed matters with sub-1 month supply.

    • Detached & condos: list crisp and market-ready; you’re in a lean-to-balanced pocket (2–2.4 MOS).

    • Row/townhomes: differentiate—professional staging, minor updates, and sharp pricing to win showings in a ~4+ MOS environment.

  • Buyers:

    • Row/townhomes offer the best negotiating window.

    • Detached/condo purchasers should be pre-approved and move promptly on the top 10% of listings.

    • Watch segment-specific MOS to gauge leverage before writing.

Schools (quick orientation for families)

  • Auburn Bay is served by a mix of public (CBE) and Catholic (CCSD) designated schools, with elementary options in/near the community and designated junior/senior high schools in nearby SE catchments. Designations can vary by address and year—buyers should verify with CBE/CCSD school-finder tools when short-listing homes.

Shopping, Services & Daily Convenience

  • Auburn Station (inside the community) covers everyday needs (groceries, coffee, services).

  • Seton Urban District (minutes away) adds big-box retail, dining, the South Health Campus, YMCA, movie theatre, and professional services—handy for commuters and hospital staff.

  • Nearby hubs (Mahogany/130th Ave SE) broaden options for dining, specialty grocers, and home goods.

Community Lifestyle & Events

  • Auburn Bay is a four-season lake community anchored by Auburn House and private beach/park space. Typical programming includes:

    • Summer: lake/beach access, paddle craft, fishing derbies, kids’ day camps, outdoor movies.

    • Shoulder seasons: community markets, fitness & arts programs.

    • Winter: skating on maintained rinks, holiday light events, family festivals.
      Residents’ Association programming varies by month—great talking point at showings and for buyer discovery days.


Your Quick Script (for listing appointments or buyer tours)

  • Semis are on fire with ~0.7 months of supply—if you’re selling, we’ll stage light, launch on a Thursday, and set offer expectations for the weekend.”

  • Row inventory is deeper—we’ll target price-to-presentation to beat competing actives and use DOM data to time price reviews.”

  • Detached holds steady: fair competition, but the top 10% of homes still move fast at/near ask when turnkey.”

Contact us for a Free Home Evaluation.

Read

卡尔加里最新房地产报告—八月份在公寓和排屋的推动下,二手房价位下降

供应选择的改善正在改变卡尔加里的市场动态,并在过去几个月推动了价格下跌。公寓和排屋的价格调整幅度较大,而独立屋和半独立屋住宅的价格仅出现温和下降。截至八月,整体住宅市场基准价格为$577,200元,较上月下降,并比去年同期低近4%。

“在看待价格调整时需要有整体视角。最显著的价格调整出现在排屋和公寓类型,因为它们也是供应选择增幅最大的物业类型。” CREB® 首席经济学家 Ann-Marie Lurie 表示,“与此同时,独立屋和半独立屋市场的价格调整,从部分区域的温和上涨到供应大幅增加区域的较大幅度下跌不等。总体来看,近期的价格调整并未抵消过去几年所取得的价格增长。”

八月份的销售量为1,989笔,比去年同期低近9%。与过去四年报告的高水平相比,销售有所放缓。然而,活动量仍高于长期趋势,反映出相对强劲的需求。发生变化的是供应情况。新上市量依然处于高位,使得销售与新上市比率维持在60%以下,并将库存推高至6,661套,这是自2019年以来八月的最高水平。

更多的库存选择与较低的销售相结合,使八月的供求比上升至3.4个月,这远高于过去四年所处的卖方市场状况,但仍远低于疫情前的买方市场水平。尽管与去年相比,市场现在更加平衡,但根据物业类型、价格区间和地理位置的不同,差异仍然显著。

独立屋(Detached)

八月份独立屋销售量放缓至995套,而新上市数量增加至1,748套,使销售与新上市比率保持在60%以下。这阻止了库存出现显著变化,库存量达到3,051套,是自2020年以来八月的最高水平。较高的库存水平和供应放缓有助于平衡独立屋市场。然而,东北区、北区和东区正经历买方市场状况。

八月份市场基准价格为$755,600元,较上月和去年同期下降近1%。尽管价格有所放缓,但不同区域差异显著。与去年相比,东北区和东区的价格降幅最大,达到5%;而市中心价格则上涨超过2%。由于大部分调整发生在过去几个月,今年迄今为止卡尔加里的价格仍比去年高出2%。

半独立屋(Semi-Detached)
八月份的销售量较去年有所提升,但不足以抵消之前的回落,年初至今的销售量为1,557套,比去年低8%,但仍高于长期趋势。同时,新上市数量放缓,相对于销售推动销售与新上市比率升至67%,并防止了库存的进一步增长。该物业类型的库存增长幅度不大,八月份的供求比仍低于3个月。这是价格未出现大幅调整的原因之一。

八月份的市场基准价格为$687,200元,较上月下降,但比去年同期高出近1%,年初至今则高出近4%。价格增长在全市范围内差异较大,市中心的年增幅最大;而东北区、东区和北区则出现了最大降幅。

排屋(Row)
八月份销售放缓,导致年初至今的销售量下降近16%。虽然与去年及上月相比,八月新上市量有所减少,但总体上仍处于上升趋势,推动了库存水平的上升。八月份库存达到1,103套,是八月历史上第二高水平,仅略低于2018年创下的纪录。由于销售仍相对强劲,供求比仅略微升至3个月以上,远比去年更平衡,但仍未达到2018年6.4个月的水平。

尽管如此,额外的供应选择对价格形成压力。八月份,排屋的市场基准价格为$439,600元,连续第四个月下跌,较去年同期低近5%。虽然各区价格均有所下降,但东北区、北区、南区和东区的价格降幅超过5%。这些区域的二手房供应普遍处于高位,或面临新房供应的显著竞争。

公寓(Apartment Condominium)
八月份销售继续放缓,导致年初至今的销售量下跌近30%。虽然销售仍高于长期趋势,但不足以抵消市场中新上市的水平。仅八月就有877套新上市,而销售量为449套,使销售与新上市比率维持在51%的低位。今年以来持续的低比率,推动了市场库存的增加。虽然八月库存量较上月没有上升,但以1,979套的水平,创下了有记录以来八月的最高库存。

自六月以来,公寓的供求比一直维持在约4个月。相对过剩的供应正在压低价格。截至八月,市场基准价格为$326,500元,已连续第五个月下降,比去年同期低近6%。大部分供应集中在市中心,该区域的价格同比下降5%,略高于西区报告的3%降幅。同时,东北区价格降幅最大,超过11%。

卡尔加里周边城镇

Airdrie
八月份销售放缓,导致年初至今的销售量下降12%,今年累计成交量为1,248套。本月152宗销售对应265宗新上市,使销售与新上市比率上升至57%,并阻止了库存的进一步增长。截至八月,库存为535套,高于长期趋势,也是疫情前以来的最高水平。供应的增加帮助市场转向更加平衡的状态。然而,由于新房、二手房市场以及周边区域的更多供应选择,艾尔德里的价格承受了一定下行压力。八月份的整体住宅基准价格为$531,100元,较上月下降,并比去年同期低4%。

Cochrane

本月70宗销售对应139宗新上市,使销售与新上市比率下降至50%,这是自2015年以来八月的最低水平。与新上市相比,销售的回落阻止了库存水平出现显著变化,并将供求比推高至四个月以上。尽管本月出现了这种变化,科克伦的价格在八月仍保持相对稳定,市场基准价格为$589,100元,与上月相近,比去年同期高出近2%。从年初至今来看,价格比去年高出4%。

Okotoks
八月份的新上市量相较销售出现显著回落,使销售与新上市比率上升至80%。尽管销售总体仍与长期趋势保持一致,但新上市数量并未像其他地区那样增加,从而阻止了库存水平的显著增长。截至八月,库存为116套,比去年同期增长29%,但仍比传统八月水平低30%。尽管市场条件趋紧,价格在月度上出现了一些下降。然而,年初至今的市场基准价格仍比去年高出2%,并且各类物业均录得价格增长。

(在DrumHeller以南,阿省依然有30套低于$15万的独立屋)

Read

JULY 2025 -Supply growth weighs on home prices

Thanks to gains mostly occurring in the newer communities, inventory levels in July were 6,917 units, reaching levels not seen since prior to the pandemic and higher than long-term trends. While supply has improved across all property types and all districts, the largest gains are occurring in the areas where there has been new community growth. 
 
The additional supply has weighed on home prices in some parts of the city. The total residential benchmark price in Calgary has trended down over the past several months and is currently four per cent below last year’s peak price reported in June 2024. 
 
“Price declines are not occurring across all property types in all locations of the city, and even where there have been declines, it has not erased all the gains made over the past several years,” said Ann-Marie Lurie, Chief Economist at CREB®. “The steepest price declines have occurred for apartment and row style homes, mostly in the North East and North districts, which coincides with significant gains in new supply.” 
 
The rise in supply occurred as sales continued to slow and new listings improved. In July, there were 2,099 sales, a 12 per cent decline over last year, while new listings reached 3,911 units, an over eight per cent increase over last year. In addition to the persistent economic uncertainty due to tariffs, sales and new listings were impacted by no further reductions in lending rates and added competition from the new home market. Apartment-style homes are reporting the highest months of supply with over four months, while both detached and semi-detached homes are seeing conditions remain relatively balanced at just three months of supply.  

Detached

For the first time since 2020, the months of supply for detached homes rose to three months. Sales activity slowed to 1,031 units in July, while the number of new listings, despite being slower than last month, was still nearly 10 per cent higher than last year’s levels and above long-term trends. The wider gap between sales and new listings led to a significant adjustment in inventory levels and, with slower sales, the months of supply rose to three months.

However, conditions did vary significantly depending on location. In the North West, West and South districts, the months of supply remained well below three months, whereas the North East reported the highest months of supply at over four months. 
 
A shift to balanced conditions has taken much of the pressure off home prices. As of July, the detached benchmark price was $761,800, down less than one per cent over last year. However, there was a significant range of price adjustments. Both the North East and East districts have reported the largest decline in price at five per cent, though prices still rose in the City Centre by nearly two per cent. 

Semi-Detached

Sales activity in July continued to slow, contributing to the year-to-date decline of 11 per cent. At the same time, new listings have generally been higher this year compared to last year, supporting inventory gains. With 549 units in inventory and 187 sales, the months of supply in July rose to three months, something that has not happened since 2021. 
 
Although supply is improving in relation to sales, prices have remained relatively stable. As of July, the benchmark price in the city was $697,500, one per cent higher than last July. Price growth did range throughout each district, with the highest gains occurring in the City Centre, with nearly three per cent growth. Meanwhile, prices declined over last year in the North East, East and North districts.

Row

Like other styles of homes, sales have eased compared to last year, with new listings and inventories rising over last July. The months of supply in July was similar to last month at over three months, with a range of under three months of supply in the City Centre, North West , South and South East, to nearly five months of supply in the North East district.
 
Row prices have generally been trending down over the past three months, and while they are nearly four per cent lower than last year at this time, on a year-to-date basis they have remained similar to last year. When considering activity by district, year-to-date price declines have been reported in the North East and North, while prices have risen in all other districts.
 

Apartment Condominium

There were 1,014 new listings in July relative to 508 sales, keeping the sales-to-new listings ratio at 50 per cent and inventory levels elevated at 2,097 units. Higher inventories and slower sales caused the months of supply to push above four months in July, the highest it has been since 2021. Added competition for new product combined with rising rental vacancy rates has impacted the resale condominium market.
 
The additional supply choice is having a more significant impact on apartment style prices over any other property type. In July, the benchmark price was $329,600, which is down over one per cent compared to last month and nearly five per cent lower than levels reported last year. However, when considering year-to-date figures, prices have remained stable compared to last year as gains in the West, South and North West have offset declines occurring in the North East, North, South East and East districts.


REGIONAL MARKET FACTS


Airdrie

Due to declines in both row and apartment sales, July sales slowed by 14 per cent compared to last July, contributing to the year-to-date decline of 12 per cent. While sales have slowed, activity remains higher than levels reported prior to 2021. What has changed is the significant improvement in new listings, resulting in inventory gains. As of July, inventory levels rose to 543 units, the highest July reported since the peak in 2018. The higher inventory levels kept the months of supply above three months in July, placing some downward pressure on home prices. In July, the benchmark price was $532,800, nearly four per cent lower than levels reported last year at this time. However, last year’s gains were exceptionally high earlier in the year, and on a year-to-date basis prices are only slightly lower than last year.

Cochrane

Unlike other areas, Cochrane has not seen the same level of pullback in sales compared to long-term trends. While July sales were down by seven per cent, year-to-date sales are two per cent lower than last year and 23 per cent higher than long-term trends. New listings in July did reach a record high for the month, causing inventories to push to the highest level reported for the month since 2019 and causing the months of supply to rise above three months. While this likely contributed to some of the monthly decline in price, unlike other areas the July benchmark price of $590,000 was over two per cent higher than last year, and four per cent higher on a year-to-date basis.

Okotoks

This market continues to exhibit tighter market conditions than both Airdrie and Cochrane with a sales-to-new-listings ratio of 71 per cent and months of supply at just over two months. This is a significant improvement compared to the previous four years, where the months of supply in July was just over one month. In July, the benchmark price in the area was $628,500, slightly lower than last month, but higher than last year’s level. Despite some monthly fluctuations, year-to-date prices are over two per cent higher than last year.

Contact us for FREE HOME EVALUATION.

Read

🏡 Auburn Bay Real Estate Market Report - July 2025

Sales & Listings:

  • Total Sales: 46 homes (unchanged YoY)

  • New Listings: 71 (⬆ 51% YoY)

  • Inventory: 101 active listings (⬆ 216% YoY)

  • Sales-to-New Listings Ratio: 0.65 — indicating a balanced to buyer’s market

  • Months of Supply: 2.20 — a slight increase, still below balanced market threshold

Benchmark Prices (YoY):

  • Total Residential: $623,300 (⬇ 4.2%)

  • Detached: $810,200 (⬇ 0.6%)

  • Semi-Detached: $526,800 (⬆ 1.7%)

  • Row House: $460,700 (⬆ 1.1%)

  • Apartment: $355,000 (⬇ 2.8%)

Average Days on Market: 35
Sale-to-List Price Ratio: 98.0%


💡 Market Insights

  • Inventory surge (+216%) is giving buyers more options and reducing upward price pressure.

  • Detached homes remain the dominant product, but higher interest rates and affordability challenges are fueling interest in row houses and apartments.

  • Apartments saw the steepest year-over-year price drop, possibly due to increased competition and a higher supply in this segment.

💼 Investment Outlook

With growing inventory and slight price softening, Auburn Bay offers strategic buying opportunities:

  • First-time buyers can enter via apartments or row homes

  • Investors may benefit from rental demand driven by lake access, amenities, and proximity to Seton Urban District and South Health Campus

  • Move-up buyers can find upgraded detached homes at relatively stable prices


🧭 Looking Ahead

If current trends continue, we may see stable pricing but longer selling times as buyers gain more leverage. However, the enduring popularity of lake communities like Auburn Bay should support long-term value.

Contact us for a Free Home Evaluation.

Read

CMHC releases 5th cycle Social and Affordable Housing Survey results

The Canada Mortgage and Housing Corporation (CMHC) unveiled the results of its fifth cycle of the Social and Affordable Housing Survey – Rental Structures (SAHS‑RS), revealing key trends in Canada’s non‑market rental housing sector on July 22, 2025.

Coverage and Response

The survey covers nearly 593,000 units across Canada, with the highest share located in Ontario (56.1%), followed by British Columbia (11.5%), Quebec (9.4%), Alberta (6.7%), and other provinces and territories. Almost 60% of these units are concentrated in eight major Census Metropolitan Areas, including Toronto (30%), Vancouver (6%), Montréal (5.3%), Edmonton, Winnipeg, Calgary, Windsor, Victoria, Kitchener–Waterloo, and St. Catharines–Niagara .

Response rates inched up from 66% to 76% nationally, as CMHC expanded administrative data coverage and refined its sampling—though Quebec remains partially excluded due to missing data from structures managed by the Société d'habitation du Québec (SHQ).

Management and Funding of Units

The survey breaks down unit management as follows:

  • 53% government-run (federal, provincial, municipal)

  • 26% non‑profit organizations

  • 7% cooperatives

  • 17% private entities or joint partnerships

This reflects a longstanding dominance of government and non‑profit providers in Canada’s social housing landscape.

In terms of funding sources:

  • Federal government: 17%

  • Provincial/Territorial: 23%

  • Municipal: 30%

  • Other organizations or mixed sources: 11%

  • No formal funding agreement: 19%—this was particularly acute in the Northwest Territories (no agreements), contrasting with only 1% in New Brunswick and 5% in Quebec lacking agreements.

For operational deficit funding:

  • Federal: 1.5%

  • Provincial/Territorial: 24%

  • Municipal: 32.4%

  • Other or mixed: 5.6%

  • No coverage: 36.5%—varied by region. For example, 95% of Saskatchewan’s units lacked operational deficit funding, compared to just 5% in Manitoba.

Demographics and Tenant Groups

CMHC asked providers what populations they were mandated to serve:

  • Seniors: 33%

  • Families with children: 25%

  • Single men or women: ~11% each

  • Persons with physical or mental disabilities: ~4% each

Single-person tenants were less common in Saskatchewan and Alberta (1–5%), but represented 15–25% of the clientele in other provinces.

In terms of service providers:

  • 56% of clientele served by government bodies

  • 29% served by non‑profits

  • Services for veterans, persons with disabilities, First Nations, Métis, Inuit, immigrants, refugees, victims of domestic violence, and formerly homeless individuals were twice as likely to be provided by non‑profits compared with governments.

Age and Condition of the Housing Stock

The sector’s housing stock is aging:

  • 15% built after 1995

  • 35% built between 1980 and 1995

  • 49% built before 1980

In Quebec and the three territories, over one‑third of units were built post‑2003. In contrast, Ontario, the Prairies and Atlantic provinces have 65–90% of stock built before 1987.

Regarding building condition:

  • 43.5% of units rated as excellent/good

  • 19% rated average

  • 37.3% rated fair or poor — a pattern largely consistent with the 2023 survey, except Saskatchewan saw a sharp shift from average to fair condition (increasing fair-rated units from ~31% to ~79%).

Newer buildings fare better: 77% of units built after 2003 were in excellent or good condition, compared to 38% of older units (pre-2003) receiving that rating.


Why It Matters

These results show a non‑market housing sector that is heavily government-supported but aging, with significant regional disparities, especially in funding coverage and building condition. The rising number of units in fair or poor condition—particularly among older stock—highlights the critical need for renovation and investment. The unequal distribution of operational deficit funding and the significant share of units serving marginalized populations underscore ongoing equity challenges for social housing policy in Canada.

(How much is your home worth? Contact us for a Free Home Evaluation.)

Read

CREA cuts 2025 forecast again but says home sales are rebounding from 'chaotic start'

For the second time this year, the Canadian Real Estate Association has downgraded its forecast for home sales in 2025, even as it says a turnaround could be looming following increased activity in June.

                                                                                Sammy Hudes, The Canadian Press Jul 15, 2025 1:12 PM

For the second time this year, the Canadian Real Estate Association has downgraded its forecast for home sales in 2025, even as it says a turnaround could be looming following increased activity in June.

The association reported that the number of homes changing hands across the country in June rose 3.5 per cent compared with a year ago. Canadian home sales last month also increased 2.8 per cent compared with May on a seasonally adjusted basis.

In its outlook released Tuesday, CREA said it now expects a total of 469,503 residential properties to be sold this year, a three per cent decline from 2024. In April, the association forecast the number of home sales for 2025 to remain essentially unchanged from last year, which itself marked a steep cut from its January forecast of an 8.6 per cent year-over-year increase.

The national average home price is forecast to fall 1.7 per cent on an annual basis to $677,368 in 2025, which would be around $10,000 lower than predicted in April.

CREA senior economist Shaun Cathcart said that despite a "chaotic start to the year," the latest data suggests the housing market rebound originally forecast for this year — before it was upended by the Canada-U.S. trade war — may have "only been delayed by a few months."

“At the national level, June was pretty close to a carbon copy of May," said Cathcart in a press release, cautioning "we’re not out of the woods yet" given U.S. President Donald Trump's latest 35 per cent tariff threat.

The association said the tariff-related uncertainty that drove so many buyers back to the sidelines earlier this year ended up taking a larger bite out of activity in B.C., Alberta and Ontario than was expected three months ago, but "the good news is markets appear to be entering their long-expected recovery phase, fuelled by pent-up demand, lower interest rates, and an economy that is expected to avoid worst-case tariff scenarios."

“Most housing markets continued to turn a corner in June, although market conditions still vary considerably depending on where you are in Canada,” said CREA chair Valérie Paquin.

“If the spring market was mostly held back by economic uncertainty, barring any further big shocks, that delayed activity could very likely surface this summer and into the fall."

CREA said it now forecasts national home sales in 2026 to improve by 6.3 per cent to 499,081. That would put activity back on track with what was expected in its April forecast, when it predicted a 2.9 per cent gain in sales next year.

The national average home price is expected to increase three per cent from 2025 to $697,929 next year.

Meanwhile, the national average sale price fell 1.3 per cent in June compared with a year earlier to $691,643.

There were 47,871 home sales recorded last month, up from 46,237 in June 2024. The association said the recovery in sales activity over the past two months was led overwhelmingly by the Greater Toronto Area.

Still, activity remains slower than usual, said Cameron Forbes, a Toronto-area broker and general manager at Re/Max Realtron Realty Inc.

"The uncertainty of the Trump tariffs and the impact on, certainly in Ontario, the manufacturing context and everything, still has a lot of buyers on the sidelines that probably shouldn't be," said Forbes in an interview.

"It's still a market where I think buyers are unfortunately a bit uncertain. Many of them who have jobs, who have security of those jobs, who have equity in homes, that would be a great time for them to make a trade to a preferred location or a larger home for their family, but they are looking at the headlines and seeing the uncertainty related to tariffs."

The number of newly listed properties throughout the country was down 2.9 per cent month-over-month from May. A total of 206,435 properties were listed for sale by the end of the month, up 11.4 per cent from a year earlier and just one per cent below the long-term average for this time of the year.

"June's sales performance came in broadly as expected, with Canadian transactions continuing their gradual recovery from their early-year depths," said TD economist Marc Ercolao in a note.

"We expect home sales will continue to rise in the second half of the year as pent-up demand continues to trickle into the market. That said, the sales level should remain subdued as economic uncertainty remains elevated, especially with Canada facing new tariff threats."

BMO senior economist Robert Kavcic said there are three major factors still holding back the housing market, including a "sluggish" job market being aggravated by the trade war. With the Bank of Canada holding its key policy rate steady, he said mortgage rates of around four per cent are also "not low enough to improve the affordability calculus in a demand-sparking way."

"And, market psychology now appears bearish," said Kavcic in a note.

"Just as expectations of higher prices drove accelerating gains on the way up, the understanding that prices are falling is holding back buyers on the way down in some locations."

Forbes added that much is riding on the outcome of ongoing trade negotiations between Canada and the U.S., which currently hold an Aug. 1 deadline. Reaching a compromise could prompt buyers to return, leading to a more "healthy market," he said.

But failing to reach an agreement on time would mean further uncertainty in the housing market, he said.

"If that's the case, then we'll continue to have fewer sales for at least the next three or four months until the impacts of whatever comes to fruition are better known."

Contact us for a Free Home Evaluation.

Read

How is rental market in Calgary?

Rents easing across most major markets but many tenants not feeling relief: CMHC

Higher turnover rents in several major rental markets have decreased tenant mobility, leading to longer average tenancy periods and "more substantial" rent increases when tenants do move, says CMHC.

Canada's housing agency says advertised rents in some major cities are easing due to factors such as increased supply and slower immigration, but renters are still not feeling relief.

In its mid-year rental market update released Tuesday, Canada Mortgage and Housing Corp. said average asking rents for a two-bedroom purpose-built apartment were down year-over-year in four of seven markets.

Vancouver led the way with a 4.9 per cent decrease in the first quarter of 2025, followed by drops of 4.2 per cent in Halifax, 3.7 per cent in Toronto and 3.5 per cent in Calgary. Average asking rents grew 3.9 per cent in Edmonton, 2.1 per cent in Ottawa and two per cent in Montreal, compared with the first quarter of 2024.

Landlords reported that vacant units are taking longer to lease, CMHC said, especially for new purpose-built rental units in Toronto, Vancouver and Calgary, where they face competition from well-supplied secondary rentals such as condominium units and single-family homes.

"Purpose-built rental operators are responding to market conditions by offering incentives to new tenants such as one month of free rent, moving allowances and signing bonuses," the report said, adding some landlords anticipate they may need to lower rents over the next couple of years.

The agency said rents for occupied units are continuing to rise but at a slower pace than a year ago. It said higher turnover rents in several major rental markets have decreased tenant mobility, leading to longer average tenancy periods and "more substantial" rent increases when tenants do move.

In 2024, the gap in rental prices between vacant and occupied two-bedroom units reached 44 per cent in Toronto, the highest among major cities, while Edmonton had the smallest gap at roughly five per cent.

Vacancy rates are expected to rise in most major cities this year amid slower population growth and sluggish job markets, CMHC said.

"As demand struggles to keep pace with new supply, the market will remain in a period of adjustment. This is particularly true in Ontario due to lowered international migration targets, especially in areas near post-secondary institutions," the report stated.

"While the market may have abundant supply in the short-term, there is still a need to maintain momentum in new rental supply to meet the needs of projected future population growth and to achieve better affordability outcomes for existing households."

Despite downward pressure on rent prices, CMHC said affordability has still worsened over time as rent-to-income ratios have steadily risen since 2020, especially in regions like Vancouver and Toronto where turnover rents are driving increases.

A separate report released Tuesday outlined similar trends across the national rental market last month.

The latest monthly report from Rentals.ca and Urbanation said asking rents for all residential properties in Canada fell 2.7 per cent year-over-year in June to $2,125, marking the ninth consecutive month of annual rent decreases.

Despite the drop, average asking rents remained 11.9 per cent above levels from three years ago and 4.1 per cent higher than two years ago, "underscoring the long-term inflationary pressure in the rental market," the report said.

Purpose-built apartment asking rents fell 1.1 per cent from a year ago to an average of $2,098, while asking rents for condos dropped 4.9 per cent to $2,207. Rents within houses and town homes fell 6.6 per cent to $2,178.

“Rent decreases at the national level have been mild so far, with the biggest declines mainly seen in the largest and most expensive cities," Urbanation president Shaun Hildebrand said in a news release.

"However, it appears that the softening in rents has begun to spread throughout most parts of the country.”

B.C. and Alberta recorded the largest decreases in June, with asking rents falling 3.1 per cent year-over-year in each province to an average of $2,472 in B.C. and $1,741 in Alberta.

That was followed by Ontario's 2.3 per cent decrease to $2,329, Manitoba's 1.3 per cent decrease to $1,625 and Quebec's 0.9 per cent decrease to $1,960. Nova Scotia's average asking rent ticked 0.1 per cent lower to $2,268, while Saskatchewan was the only province to record year-over-year growth, at 4.2 per cent, to an average of $1,396.

This report by The Canadian Press was first published July 8, 2025.

Sammy Hudes, The Canadian Press

Read
Data is supplied by Pillar 9™ MLS® System. Pillar 9™ is the owner of the copyright in its MLS®System. Data is deemed reliable but is not guaranteed accurate by Pillar 9™.
The trademarks MLS®, Multiple Listing Service® and the associated logos are owned by The Canadian Real Estate Association (CREA) and identify the quality of services provided by real estate professionals who are members of CREA. Used under license.