RSS

CMHC releases 5th cycle Social and Affordable Housing Survey results

The Canada Mortgage and Housing Corporation (CMHC) unveiled the results of its fifth cycle of the Social and Affordable Housing Survey – Rental Structures (SAHS‑RS), revealing key trends in Canada’s non‑market rental housing sector on July 22, 2025.

Coverage and Response

The survey covers nearly 593,000 units across Canada, with the highest share located in Ontario (56.1%), followed by British Columbia (11.5%), Quebec (9.4%), Alberta (6.7%), and other provinces and territories. Almost 60% of these units are concentrated in eight major Census Metropolitan Areas, including Toronto (30%), Vancouver (6%), Montréal (5.3%), Edmonton, Winnipeg, Calgary, Windsor, Victoria, Kitchener–Waterloo, and St. Catharines–Niagara .

Response rates inched up from 66% to 76% nationally, as CMHC expanded administrative data coverage and refined its sampling—though Quebec remains partially excluded due to missing data from structures managed by the Société d'habitation du Québec (SHQ).

Management and Funding of Units

The survey breaks down unit management as follows:

  • 53% government-run (federal, provincial, municipal)

  • 26% non‑profit organizations

  • 7% cooperatives

  • 17% private entities or joint partnerships

This reflects a longstanding dominance of government and non‑profit providers in Canada’s social housing landscape.

In terms of funding sources:

  • Federal government: 17%

  • Provincial/Territorial: 23%

  • Municipal: 30%

  • Other organizations or mixed sources: 11%

  • No formal funding agreement: 19%—this was particularly acute in the Northwest Territories (no agreements), contrasting with only 1% in New Brunswick and 5% in Quebec lacking agreements.

For operational deficit funding:

  • Federal: 1.5%

  • Provincial/Territorial: 24%

  • Municipal: 32.4%

  • Other or mixed: 5.6%

  • No coverage: 36.5%—varied by region. For example, 95% of Saskatchewan’s units lacked operational deficit funding, compared to just 5% in Manitoba.

Demographics and Tenant Groups

CMHC asked providers what populations they were mandated to serve:

  • Seniors: 33%

  • Families with children: 25%

  • Single men or women: ~11% each

  • Persons with physical or mental disabilities: ~4% each

Single-person tenants were less common in Saskatchewan and Alberta (1–5%), but represented 15–25% of the clientele in other provinces.

In terms of service providers:

  • 56% of clientele served by government bodies

  • 29% served by non‑profits

  • Services for veterans, persons with disabilities, First Nations, Métis, Inuit, immigrants, refugees, victims of domestic violence, and formerly homeless individuals were twice as likely to be provided by non‑profits compared with governments.

Age and Condition of the Housing Stock

The sector’s housing stock is aging:

  • 15% built after 1995

  • 35% built between 1980 and 1995

  • 49% built before 1980

In Quebec and the three territories, over one‑third of units were built post‑2003. In contrast, Ontario, the Prairies and Atlantic provinces have 65–90% of stock built before 1987.

Regarding building condition:

  • 43.5% of units rated as excellent/good

  • 19% rated average

  • 37.3% rated fair or poor — a pattern largely consistent with the 2023 survey, except Saskatchewan saw a sharp shift from average to fair condition (increasing fair-rated units from ~31% to ~79%).

Newer buildings fare better: 77% of units built after 2003 were in excellent or good condition, compared to 38% of older units (pre-2003) receiving that rating.


Why It Matters

These results show a non‑market housing sector that is heavily government-supported but aging, with significant regional disparities, especially in funding coverage and building condition. The rising number of units in fair or poor condition—particularly among older stock—highlights the critical need for renovation and investment. The unequal distribution of operational deficit funding and the significant share of units serving marginalized populations underscore ongoing equity challenges for social housing policy in Canada.

(How much is your home worth? Contact us for a Free Home Evaluation.)

Read

CREA cuts 2025 forecast again but says home sales are rebounding from 'chaotic start'

For the second time this year, the Canadian Real Estate Association has downgraded its forecast for home sales in 2025, even as it says a turnaround could be looming following increased activity in June.

                                                                                Sammy Hudes, The Canadian Press Jul 15, 2025 1:12 PM

For the second time this year, the Canadian Real Estate Association has downgraded its forecast for home sales in 2025, even as it says a turnaround could be looming following increased activity in June.

The association reported that the number of homes changing hands across the country in June rose 3.5 per cent compared with a year ago. Canadian home sales last month also increased 2.8 per cent compared with May on a seasonally adjusted basis.

In its outlook released Tuesday, CREA said it now expects a total of 469,503 residential properties to be sold this year, a three per cent decline from 2024. In April, the association forecast the number of home sales for 2025 to remain essentially unchanged from last year, which itself marked a steep cut from its January forecast of an 8.6 per cent year-over-year increase.

The national average home price is forecast to fall 1.7 per cent on an annual basis to $677,368 in 2025, which would be around $10,000 lower than predicted in April.

CREA senior economist Shaun Cathcart said that despite a "chaotic start to the year," the latest data suggests the housing market rebound originally forecast for this year — before it was upended by the Canada-U.S. trade war — may have "only been delayed by a few months."

“At the national level, June was pretty close to a carbon copy of May," said Cathcart in a press release, cautioning "we’re not out of the woods yet" given U.S. President Donald Trump's latest 35 per cent tariff threat.

The association said the tariff-related uncertainty that drove so many buyers back to the sidelines earlier this year ended up taking a larger bite out of activity in B.C., Alberta and Ontario than was expected three months ago, but "the good news is markets appear to be entering their long-expected recovery phase, fuelled by pent-up demand, lower interest rates, and an economy that is expected to avoid worst-case tariff scenarios."

“Most housing markets continued to turn a corner in June, although market conditions still vary considerably depending on where you are in Canada,” said CREA chair Valérie Paquin.

“If the spring market was mostly held back by economic uncertainty, barring any further big shocks, that delayed activity could very likely surface this summer and into the fall."

CREA said it now forecasts national home sales in 2026 to improve by 6.3 per cent to 499,081. That would put activity back on track with what was expected in its April forecast, when it predicted a 2.9 per cent gain in sales next year.

The national average home price is expected to increase three per cent from 2025 to $697,929 next year.

Meanwhile, the national average sale price fell 1.3 per cent in June compared with a year earlier to $691,643.

There were 47,871 home sales recorded last month, up from 46,237 in June 2024. The association said the recovery in sales activity over the past two months was led overwhelmingly by the Greater Toronto Area.

Still, activity remains slower than usual, said Cameron Forbes, a Toronto-area broker and general manager at Re/Max Realtron Realty Inc.

"The uncertainty of the Trump tariffs and the impact on, certainly in Ontario, the manufacturing context and everything, still has a lot of buyers on the sidelines that probably shouldn't be," said Forbes in an interview.

"It's still a market where I think buyers are unfortunately a bit uncertain. Many of them who have jobs, who have security of those jobs, who have equity in homes, that would be a great time for them to make a trade to a preferred location or a larger home for their family, but they are looking at the headlines and seeing the uncertainty related to tariffs."

The number of newly listed properties throughout the country was down 2.9 per cent month-over-month from May. A total of 206,435 properties were listed for sale by the end of the month, up 11.4 per cent from a year earlier and just one per cent below the long-term average for this time of the year.

"June's sales performance came in broadly as expected, with Canadian transactions continuing their gradual recovery from their early-year depths," said TD economist Marc Ercolao in a note.

"We expect home sales will continue to rise in the second half of the year as pent-up demand continues to trickle into the market. That said, the sales level should remain subdued as economic uncertainty remains elevated, especially with Canada facing new tariff threats."

BMO senior economist Robert Kavcic said there are three major factors still holding back the housing market, including a "sluggish" job market being aggravated by the trade war. With the Bank of Canada holding its key policy rate steady, he said mortgage rates of around four per cent are also "not low enough to improve the affordability calculus in a demand-sparking way."

"And, market psychology now appears bearish," said Kavcic in a note.

"Just as expectations of higher prices drove accelerating gains on the way up, the understanding that prices are falling is holding back buyers on the way down in some locations."

Forbes added that much is riding on the outcome of ongoing trade negotiations between Canada and the U.S., which currently hold an Aug. 1 deadline. Reaching a compromise could prompt buyers to return, leading to a more "healthy market," he said.

But failing to reach an agreement on time would mean further uncertainty in the housing market, he said.

"If that's the case, then we'll continue to have fewer sales for at least the next three or four months until the impacts of whatever comes to fruition are better known."

Contact us for a Free Home Evaluation.

Read

How is rental market in Calgary?

Rents easing across most major markets but many tenants not feeling relief: CMHC

Higher turnover rents in several major rental markets have decreased tenant mobility, leading to longer average tenancy periods and "more substantial" rent increases when tenants do move, says CMHC.

Canada's housing agency says advertised rents in some major cities are easing due to factors such as increased supply and slower immigration, but renters are still not feeling relief.

In its mid-year rental market update released Tuesday, Canada Mortgage and Housing Corp. said average asking rents for a two-bedroom purpose-built apartment were down year-over-year in four of seven markets.

Vancouver led the way with a 4.9 per cent decrease in the first quarter of 2025, followed by drops of 4.2 per cent in Halifax, 3.7 per cent in Toronto and 3.5 per cent in Calgary. Average asking rents grew 3.9 per cent in Edmonton, 2.1 per cent in Ottawa and two per cent in Montreal, compared with the first quarter of 2024.

Landlords reported that vacant units are taking longer to lease, CMHC said, especially for new purpose-built rental units in Toronto, Vancouver and Calgary, where they face competition from well-supplied secondary rentals such as condominium units and single-family homes.

"Purpose-built rental operators are responding to market conditions by offering incentives to new tenants such as one month of free rent, moving allowances and signing bonuses," the report said, adding some landlords anticipate they may need to lower rents over the next couple of years.

The agency said rents for occupied units are continuing to rise but at a slower pace than a year ago. It said higher turnover rents in several major rental markets have decreased tenant mobility, leading to longer average tenancy periods and "more substantial" rent increases when tenants do move.

In 2024, the gap in rental prices between vacant and occupied two-bedroom units reached 44 per cent in Toronto, the highest among major cities, while Edmonton had the smallest gap at roughly five per cent.

Vacancy rates are expected to rise in most major cities this year amid slower population growth and sluggish job markets, CMHC said.

"As demand struggles to keep pace with new supply, the market will remain in a period of adjustment. This is particularly true in Ontario due to lowered international migration targets, especially in areas near post-secondary institutions," the report stated.

"While the market may have abundant supply in the short-term, there is still a need to maintain momentum in new rental supply to meet the needs of projected future population growth and to achieve better affordability outcomes for existing households."

Despite downward pressure on rent prices, CMHC said affordability has still worsened over time as rent-to-income ratios have steadily risen since 2020, especially in regions like Vancouver and Toronto where turnover rents are driving increases.

A separate report released Tuesday outlined similar trends across the national rental market last month.

The latest monthly report from Rentals.ca and Urbanation said asking rents for all residential properties in Canada fell 2.7 per cent year-over-year in June to $2,125, marking the ninth consecutive month of annual rent decreases.

Despite the drop, average asking rents remained 11.9 per cent above levels from three years ago and 4.1 per cent higher than two years ago, "underscoring the long-term inflationary pressure in the rental market," the report said.

Purpose-built apartment asking rents fell 1.1 per cent from a year ago to an average of $2,098, while asking rents for condos dropped 4.9 per cent to $2,207. Rents within houses and town homes fell 6.6 per cent to $2,178.

“Rent decreases at the national level have been mild so far, with the biggest declines mainly seen in the largest and most expensive cities," Urbanation president Shaun Hildebrand said in a news release.

"However, it appears that the softening in rents has begun to spread throughout most parts of the country.”

B.C. and Alberta recorded the largest decreases in June, with asking rents falling 3.1 per cent year-over-year in each province to an average of $2,472 in B.C. and $1,741 in Alberta.

That was followed by Ontario's 2.3 per cent decrease to $2,329, Manitoba's 1.3 per cent decrease to $1,625 and Quebec's 0.9 per cent decrease to $1,960. Nova Scotia's average asking rent ticked 0.1 per cent lower to $2,268, while Saskatchewan was the only province to record year-over-year growth, at 4.2 per cent, to an average of $1,396.

This report by The Canadian Press was first published July 8, 2025.

Sammy Hudes, The Canadian Press

Read

卡尔加里房地产市场报告 - 6月份

2025年6月,卡尔加里住宅市场继续保持平稳运行态势。尽管销量同比有所下降,但新增挂牌量的增加推动库存水平持续上升。数据显示,6月总住宅销售为2,286套,较去年同期下降16.5%。与此同时,新上市房源达到4,223套,同比增长11.2%,库存总量攀升至6,941套,较去年同期增长83.2%。供应周期也升至3.04个月,表明市场正逐步趋于平衡。 

根据统计数据,6月民宅市场基准价格为$586,200,比五月份略有下滑,并较去年同期下降3.6%。不同物业类型的价格走势出现分化,其中独立屋和半独立屋仍维持稳定或小幅上涨,而联排别墅与公寓则出现温和下调。这一趋势主要受到新房和租赁市场供应改善的影响,削弱了转售市场的价格支撑力。

🧩 独立屋市场亮点分析

  1. 主力市场段落:

    • 60–80万元区间占据主导,合计成交560套,占整体市场 45.61%

    • 说明大多数买家仍集中在中端市场,尤其是首次购房或升级换房人群。

  2. 价格上涨压力最大区间:

    • 200–300万元区间中有 46.67% 房屋以高于挂牌价售出,表明高端买家竞争激烈。

    • 90–120万元区间同样强势,逾 1/3 以上以高于要价成交。

  3. 低价段市场逐渐冷却:

    • 50万元以下的房产仅占市场 3.58%,说明此价位挂牌量稀少,或产品老旧吸引力不足-因为售价高于要价的比率并没有离奇的高。


📈 趋势判断

  • 竞争最激烈价位段:
    90–100万元区间,超4成房源溢价成交,适合卖家把握时机挂牌。

  • 供需平衡良好价位段:
    70–80万元区间,成交量高达255套,且溢价率为25.49%,市场接受度高。

  • 投资者关注焦点:
    200–300万段表现突出,适合高端独立屋、翻新物业、内城区精品楼盘。


六月份独立屋成交量前十名社区分别为:

独立屋(Detached)

独立屋市场在6月依旧表现出较强的韧性。全市共成交1,094套,虽然比五月份下降9%,但其基准价格保持在$764,300高位,仅比去年同期微降0.4%。新增挂牌数量显著上升,达1,348套,使库存增至3,107套,同比增长59%。供需比例维持在相对健康的水平,供应周期为3.04个月,销售与新上市比为59%,显示出市场仍在买方与卖方之间保持一定平衡。  

区域方面,市中心、西区和西北区房价依然坚挺,而东北区因供应增加导致价格小幅回落。


半独立屋(Semi-Detached)

半独立屋在6月的成交数量仅为212套,同比大幅减少95%。然而,该类型的基准价格仍维持在$696,400,同比上涨1.5%。新增挂牌数量增长明显,达到555套,库存因此增至622套,同比增长105%。尽管如此,由于建筑趋势逐渐从半独立屋转向联排住宅,该类房源在整个市场中占比仍然较低。  

西北区仍是该类型房产最紧俏的区域,价格继续上升。


排屋(Row/Townhouses)

联排别墅市场在6月面临较大下行压力。尽管销售数量仍达348套,但同比减少了69%。新增挂牌数量高达2,097套,同比增长137%,库存也随之增至2,167套。供应周期升至3.35个月,销售与新上市比率为53%,反映出竞争减弱。受此影响,联排别墅的基准价格降至$450,300,同比下跌3%。

北区、西北区及南区报告了价格同比下降的情况,主要原因是新建房产供应增加,压制了转售市场需求。


共管公寓(Apartments)

公寓市场在6月继续承压。共成交532套,远低于去年同期水平。新增挂牌数量为1,024套,同比增长72%,库存增至2,112套,使供应周期升至3.97个月。销售与新增挂牌比降至52%,反映出买家议价能力增强。公寓基准价格降至$333,500,同比下降3%。 

东北区与东南区价格降幅最为明显,新建房产的竞争对转售价格形成较大冲击。

更多房地产资讯,请看这里

Read

Gains in resale supply mostly impact apartment and row style home prices

Inventory levels in June continued to rise, both over last month’s and last year’s levels. By the end of the month, inventory reached 6,941 units, returning to levels reported in 2021, or prior to the surge in population growth. While sales have remained consistent with long-term trends despite a decline from recent months, higher levels of new listings compared to sales have contributed to the inventory gain.

All property types have reported gains in inventory, but both row and apartment style homes reported inventory levels over 30 per cent higher than long-term trends, while supply for detached and semi-detached units are only slightly higher than typical levels.

“Supply has improved across rental, resale and new home markets, allowing for more choice for those considering their housing options,” said Ann-Marie Lurie, Chief Economist at CREB®. “The additional choice combined with no further declines in lending rates, persistent uncertainty and concerns of price adjustments is keeping many potential purchasers on the sidelines. This is weighing on home prices, especially for apartment and row style homes.”

The unadjusted benchmark price was $586,200 in June, lower than last month and over three per cent lower than last year. Much of the citywide decline was driven by apartment and row style homes, which are over three per cent lower than last year. Meanwhile, detached prices have remained relatively stable and semi-detached homes are still slightly higher than last year.

The steeper price declines for apartment and row style homes are reflective of those segments shifting toward a market that favours the buyer with nearly four months of supply. Meanwhile conditions are relatively balanced for detached and semi-detached homes. Overall conditions in Calgary have changed, but not enough to erase the significant growth in prices that have occurred over the past four years.
 

Detached

Sales in June were 1,194 units, six per cent lower than both last year and last month's activity. Sales activity did vary depending on location and price range, with declines in resale sales mostly for higher priced homes that likely face more competition from new homes. On a location basis, the steepest declines in sales occurred in the City Centre and the North East at over 20 per cent, while year-over-year gains were reported in the West, and South East districts. 
 
While sales did vary, inventories and new listings improved across most price ranges and districts in the city. However, it is only the North East district that is experiencing conditions that favour the buyer, causing prices to decline by four per cent compared to last June. As of June, the unadjusted benchmark price in Calgary was $764,300, less than one per cent lower than both last month and last year’s price.

Semi-Detached

Sales activity continued to slow this month, contributing to the year-to-date decline of nearly 12 per cent. At the same time new listings have generally been rising compared to last year, supporting inventory gains and a shift to balanced conditions. As of June, the months of supply was 2.6 months, a significant improvement over the tight conditions reported last year.
 
Additional supply choice has slowed the pace of price growth for semi-detached homes. As of June, the benchmark price in the city was $696,400, similar to last month, and over one per cent higher than last June. Price movements did range by district, as homes in the City Centre are over three per cent higher than last year and at record high levels, while prices in the North, North East, and East districts are all over two per cent lower than last year and three per cent lower than last year’s peak price.

Row

New listings continue to rise relative to the number of sales in the market, as the sales-to-new listings ratio in June dropped to 50 percent. This contributed to further inventory gains with 1,167 units available at the end of the month. While sales are still higher than long-term trends, the recent gains in inventory levels have caused the months of supply to push above three months. Within the city, conditions range with nearly six months of supply in the North East and two and a half months of supply in the North West.
 
Higher supply levels relative to demand are weighing on prices which, at a June benchmark price of $450,300, are down over last month and three per cent lower than last year’s levels. However, as the level of oversupply does range across the districts, so too do the price movements. The City Centre has seen the most stability in prices this month and is only one per cent below last year’s peak. Meanwhile, the North East is reporting year-over-year price declines of nearly six per cent.
 

Apartment Condominium

June new listings and sales both eased over last month’s and last year’s levels. However, with 1,024 new listings and 532 sales, inventories continued to rise and the months of supply pushed up to nearly four months. Slower international migration numbers are weighing on housing demand just as supply levels are rising, which is having a larger impact on apartment style homes.
 
The rising supply choice, both in new and resale markets, has caused resale prices to trend down again this month, leaving June’s benchmark price of $333,500 over three per cent lower than last year’s levels. While prices have eased across all districts in the city, the largest year-over-year declines are occurring in the North East, North and South East districts.


REGIONAL MARKET FACTS


Airdrie

Thanks to a sharp decline in detached activity, sales in June fell to 164 units. The pullback in sales was met with 324 new listings, causing the sales-to-new listings ratio to drop to 51 per cent, the lowest ratio reported in June since 2018. The wider spread between sales and new listings drove further inventory gains and for the first time since 2020 the months of supply was above three months. The additional supply choice has weighed on resale prices, which have trended down for the second consecutive month. In June the benchmark price was $538,300, nearly three per cent lower than levels seen last year at this time.

Cochrane

Gains for detached and semi-detached sales were offset by pullbacks for row and apartment units, as June sales remained relatively unchanged over last year. The 101 sales in June were met with 171 new listings and the sales-to-new listings ratio rose to 59 per cent. This slowed the pace of inventory growth, keeping the months of supply just below three months. While conditions are more balanced than they have been, prices in the area continue to rise albeit at a slower pace. As of June, the unadjusted benchmark price was $593,700, nearly one per cent higher than last month and four per cent higher than last June.

Okotoks

While levels are better than last year, both sales and new listings trended down in June, causing the sales-to-new listings ratio to rise to 87 per cent. This prevented any further monthly inventory gains and ensured that the months of supply remained below two months in June. While conditions remain tight in Okotoks, more supply in the broader region has likely prevented stronger price growth in the Town of Okotoks. As of June, the unadjusted benchmark price was $632,800, similar to last month and nearly three per cent higher than last year.

Contact us for a Free Home Evaluation.

Read

🏘️ Calgary Seton Real Estate Market Report - Q2

Seton remains one of Calgary’s fastest-growing urban districts, offering a vibrant mix of housing, retail, healthcare, and education. In Q2 2025, Seton experienced softening sales and rising inventory — a pattern seen across many SE communities — especially within the apartment market.

  • Total Sales: 52 units (▼17% YoY)

  • New Listings: 117 (▼2% YoY)

  • Total Inventory: 91 units (↑42% YoY)

  • Benchmark Residential Price (June): $377,467 (▼3.2% YoY)

  • Months of Supply: 2.63 (↑71% YoY)


🏠 Performance by Property Type

🔹 Apartments (Majority of Sales)

  • Sales: 49 units (↓15%)

  • New Listings: 111 (↓2%)

  • Benchmark Price: $377,467 (↓3.2% YoY)

  • Market Trend: Seton’s apartment-heavy market is cooling. High supply and affordability continue to attract first-time buyers and investors, but price pressures remain downward due to oversupply.

🔹 Row/Townhomes

  • Sales: 3 units (low sample size)

  • Benchmark Price: Not statistically reliable due to volume

  • Trend: Limited product available in this category, but ongoing development may expand townhome offerings by 2026.

🔹 Detached & Semi-Detached

  • Not applicable for Q2 2025 – no recorded benchmark or sales activity for these property types in Seton. Most detached homes in the area are still under development or pre-construction.


⏱️ Days on Market (DOM)

While specific DOM values are not individually broken out in the dataset, Seton’s months of supply rose 71% to 2.63 months, indicating longer time on market. Buyers have more selection and leverage, particularly in the apartment segment, where competition among sellers is increasing.


🧑‍🎓 Schools in Seton

Seton is positioned as an education and health hub in Calgary’s southeast. Nearby and serving Seton residents:

  • Joane Cardinal-Schubert High School (CBE) – Full high school program; modern facility.

  • All Saints High School (Catholic) – Located nearby in Legacy.

  • Elementary and middle school students are served by neighboring communities such as Auburn Bay, Mahogany, and Cranston until future Seton schools are completed.

📌 Future School Sites: Designated locations for new K–9 schools have been approved in Seton’s long-term plan to accommodate future growth.


🏙️ Seton is Calgary’s urban core of the south, offering one of the city’s most integrated live-work-play environments.

🏗️ Urban Planning & Growth

  • Mixed-use high-density zoning attracts both residential and commercial investment

  • New apartment and condo developments continue to expand along Seton Blvd and Market Street

  • Additional park space and pedestrian linkages under development in 2025

🏥 Amenities

  • South Health Campus Hospital – Full-service medical care and employment anchor

  • Seton YMCA – Calgary’s largest recreational facility with swimming pools, fitness center, library, and skating rink

  • Cineplex VIP Theatre, Superstore, Shoppers Drug Mart, banks, clinics, and dining all within walking distance


📈 Market Outlook

✅ For Buyers:

  • Apartments remain highly affordable and offer exceptional walkability

  • Ample inventory and longer DOM provide room to negotiate

  • Strong rental demand in Seton makes it attractive for investors

✅ For Sellers:

  • Price sensitivity is increasing; units must be competitively priced and marketed

  • Staging, professional photography, and highlighting Seton’s lifestyle perks are essential to stand out

  • The oversupply of condos in similar price brackets requires strategic positioning


Q2 2025 marks a cooling phase in Seton’s real estate market, particularly in its apartment sector. While sales declined and inventory grew, Seton continues to hold long-term value due to:

  • Its position as Calgary’s SE urban center

  • Access to world-class health, recreation, and retail amenities

  • Ongoing infrastructure and residential development

Buyers should act carefully but confidently, while sellers will need to align expectations with market realities.

Contact us for a Free Home Evaluation.

Read

🏘️ Calgary Auburn Bay Real Estate Market Report - Q2

📊 Market Overview – Auburn Bay

Auburn Bay entered a transitional phase in Q2 2025, with growing inventory, softer sales volume, and price adjustments across most property types. Although the community remains popular for families, the shift toward a balanced-to-buyer's market created new dynamics for sellers and buyers alike.

  • Total Sales (Q2): 127 units (↓28% YoY)

  • New Listings: 238 (↑22% YoY)

  • Inventory Level (End of Q2): 113 units (↑95% YoY)

  • Quarterly Benchmark Price (June): $621,467 (↓4.2% YoY)

  • Quarterly Average Days on Market (DOM): ~25–34 days (↑8–12 days YoY)

  • Months of Supply: 2.67 months (↑168% YoY)


🏠 Market Performance by Property Type

🔹 Detached Homes

  • Total Sales: 54 homes (↓33%)

  • New Listings: 117 (↑15%)

  • Benchmark Price (June): $801,633 (↓2.2% YoY)

  • Average DOM: 32 days

  • Trend: While detached homes remain desirable, the inventory surge softened prices. Sellers face longer selling timelines unless priced competitively.

🔹 Semi-Detached Homes (Duplex)

  • Total Sales: 13 homes (↓24%)

  • Benchmark Price: $524,433 (↓1.1%)

  • Average DOM: 28 days

  • Trend: This segment shows moderate stability but slower absorption rates as buyer caution increases.

🔹 Row Homes (Townhouses)

  • Total Sales: 33 homes (↑10%)

  • Benchmark Price: $470,133 (↔ YoY)

  • Average DOM: 24 days

  • Trend: A bright spot in the market — row homes are seeing solid buyer activity due to affordability and modern layouts.

🔹 Apartments

  • Total Sales: 27 homes (↓41%)

  • Benchmark Price: $359,400 (↓6.3%)

  • New Listings: 61 (↑72%)

  • Average DOM: 34 days

  • Trend: High inventory and weak sales volume place downward pressure on prices. Great value for investors or first-time buyers.


⏱️ Days on Market (DOM) Trend

Across Q2 2025, DOM rose across all property types:

  • Detached homes: From 24 to 32 days

  • Apartments: From 26 to 34 days

  • Row homes: Averaging 24 days but beginning to lengthen

This aligns with increased months of supply and softening sales-to-listing ratios — reflecting a more cautious buyer pool.


🧑‍🎓 Schools in Auburn Bay

Auburn Bay continues to be a highly desirable location for families due to its proximity to schools:

  • Auburn Bay School (K–4, CBE)

  • Lakeshore School (Grades 5–9, CBE) – Serves growing middle school population

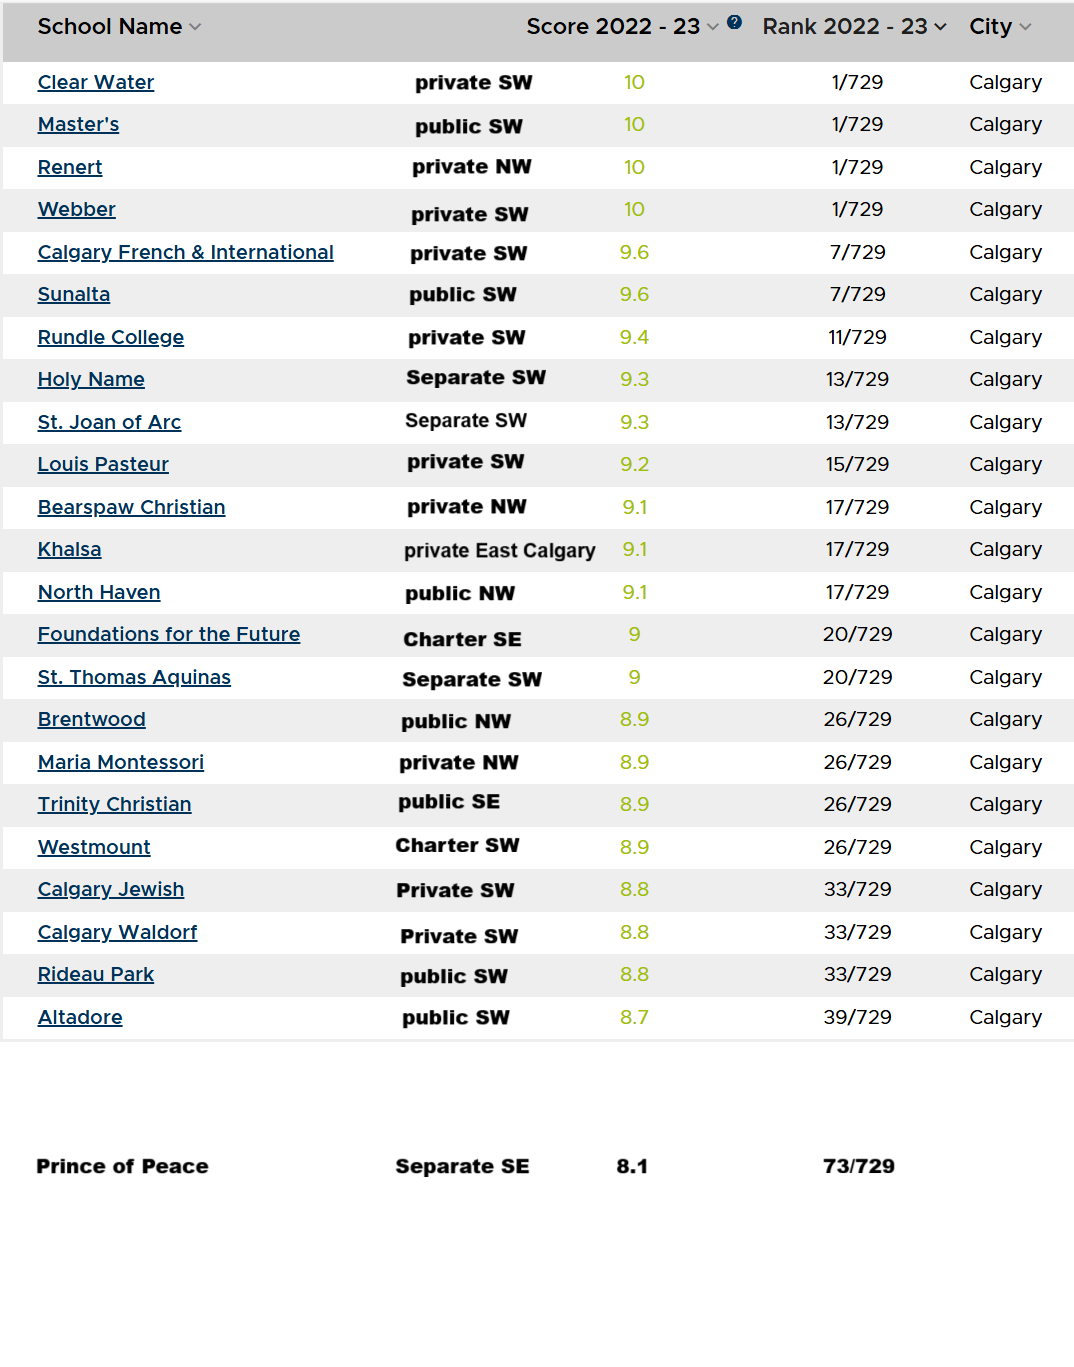
  • Prince of Peace School (K–9, Catholic) – Popular for Catholic families

  • Joane Cardinal-Schubert High School – Located in adjacent Seton

Most schools remain well-ranked and accessible via walking or short drive, supporting Auburn Bay’s family-first reputation.


🌟 Community Features & Lifestyle

🏞️ Features:

  • 43-acre private lake with beaches, swimming, skating, and boating

  • Auburn House: Community center, gym, event rental space

  • Off-leash dog park, tennis courts, and recreational fields

  • Extensive bike paths and parks throughout the neighborhood

🛍️ Nearby Amenities:

  • Seton Urban District with:

    • South Health Campus hospital

    • Calgary’s largest YMCA

    • Cineplex, Superstore, and dining options


📈 Market Outlook

✅ For Buyers:

  • More selection and leverage, particularly in apartments and detached segments

  • Opportunities to negotiate price or add conditions

  • Townhomes remain competitive — act quickly if priced fairly

✅ For Sellers:

  • Prepare for longer DOM and increased competition

  • Homes in excellent condition, priced to market, are still moving

  • Professional marketing, staging, and proper pricing are essential in Q3


In Q2 2025, Auburn Bay transitioned toward a more balanced real estate market with:

  • Declining sales volumes

  • Elevated inventory

  • Extended selling timelines

That said, demand for townhomes remains healthy, and the community continues to thrive due to its lake lifestyle, school network, and walkable amenities. Both buyers and sellers must approach Q3 strategically to succeed.

Contact us for a Free Home Evaluation.

For latest community market report, SIGNUP HERE.

Read

Mortgage‑free retirement? Not so for 29% of soon‑to‑be retirees

While previous generations aspired to enter retirement unburdened by housing debt, a growing share of Canadian retirees are facing a different reality. A new Royal LePage–Leger survey of 1,626 adults, conducted found that 29 per cent—or nearly one in three Canadians planning to retire in the next two years—expect to still be paying a mortgage when they stop working. Mortgage‑free retirement? Not so for 29% of soon‑to‑be retirees (Global News)

Key Findings

  • Still paying mortgages: 29 percent of near‑retirees (spring 2025) anticipate entering retirement with ongoing mortgage obligations biv.com.

  • Mortgage‑free cohort: 45 percent have already paid off their mortgage, with another 6 percent confident they’ll clear it before retiring.

  • Homeownership later in life: Canadians are buying homes later, with amortization schedules (often 30 years) pushing mortgage payoffs well into traditional retirement years globalnews.ca.

  • Rising mortgage debt among seniors: Canadian seniors with mortgages doubled from 14 percent in 2016 to roughly 28 percent by 2025.

  • Split on downsizing: Approaching retirees are divided—46 percent plan to downsize within two years of retiring, while 47 percent intend to stay put.

Why the Shift?

Phil Soper, CEO of Royal LePage, points to housing affordability pressures as a major factor. Escalating home prices, delayed entry into ownership, and financial support extended to adult children have stretched mortgage timelines. While the payoff represents financial liberation and stability, this generation is redefining retirement realities.

How Retirees Are Coping

Despite the odds, many are finding ways to manage:

  • Supplemental income sources: Investment earnings, part‑time employment, or support from a working spouse are helping bridge monthly payments .

  • Financial planning strategies: Advisors suggest delaying Canada Pension Plan withdrawals (until age 70), tapping into investments prudently, or pairing mortgage debt with diversified retirement funding.

Bigger Picture: Canada’s Housing Crisis

The trend reflects broader affordability challenges. The Bank of Canada's housing affordability index reached its worst since 1982, with average homes costing over nine times annual household incomes in 2023. Although interest rates have declined, high prices persist, hampering homeownership .


What It Means for You

  1. Plan for mortgage payments into retirement: If you’re close to normal amortization timelines, build mortgage payments into your budget after leaving the workforce.

  2. Delay CPP to maximize income: Eating into your investment portfolio to pay the mortgage may backfire—waiting until age 70 to draw CPP can significantly boost monthly income.

  3. Downsizing: Pros and Cons: Downsizing can reduce expenses and help pay off your mortgage—but only if you weigh factors like moving costs, emotional ties, and future home equity needs.

  4. Consider equity-based solutions: Reverse mortgages (e.g., offered by HomeEquity Bank) allow Canadians 55+ to access home equity without monthly repayments. They can be an option—but total interest may reduce estate value.


What was once a cornerstone milestone—mortgage‑free retirement—has become an increasingly elusive goal. Nearly one-third of near‑retirees now carrying mortgage debt reflects deeper housing affordability issues. But smart financial planning, diversified income strategies, and an openness to options like downsizing or equity loans can help mitigate risks and preserve stability in retirement.

More Real Estate news or market reports, please check here.

Contact us for a Free Home Evaluation.

Read

BoC Holds Key Interest Rate Again

The Bank of Canada kept its key overnight lending rate at 2.75% again Wednesday.

This marks the second straight hold after the central bank’s rate-cutting streak of seven consecutive reductions ended in April amid the trade war with the U.S. that is wreaking havoc on Canadian monetary policy.

In recent months, the BoC has adopted a strategy that puts more emphasis on assessing short-term impacts, such as economic shocks, economic shocks, rather than usual long-term outlooks when considering whether to hike, hold or cut rates.

The BoC maintained the hold because the bank’s governing council wants to get more information on how U.S. tariffs on Canadian imports could further affect Canada’s economy, BoC Governor Tiff Macklem said during a news conference after Wednesday’s decision.

The hold and Macklem’s comments came on the same day that U.S. President Donald Trump imposed a 50% tariff on steel imports from Canada and a number of other countries, with the exception of the U.K.

“Uncertainty remain high,” Macklem told reporters.

BMO Chief Economist Douglas Porter told The Canadian Press that the uncertainty “really is a doubled-edged sword” for the BoC.

“It doesn’t mean that they should cut more or less,” Porter told CP. “It just makes it more and more uncertain, and they almost have to take it on a meeting-by-meeting basis.”

The hold was widely expected.

First-quarter Canadian economic growth exceeded the bank’s expectation, but compound growth came in as anticipated, Leslie Preston, a TD Bank managing director and senior economist, wrote in a research note provided to Connect. She noted that the economy is softer but not sharply weaker. However, the bank remains concerned about unexpected firm inflation and its preferred measures of inflation have risen.

The BoC also expects the economy to be “considerably weaker” in the second quarter as strong exports and inventories reverse while demand remains “subdued.”

“We expect that barring a trade negotiation miracle with the Trump administration, Canada’s economy is likely to tip into recession this year, and more interest-rate cuts will be required,” wrote Preston.

                                                                                                                                                                                                                                   By: Monte Stewart @Connect Canada

More Real Estate news or market reports, please check here.

Contact us for a Free Home Evaluation.
Read

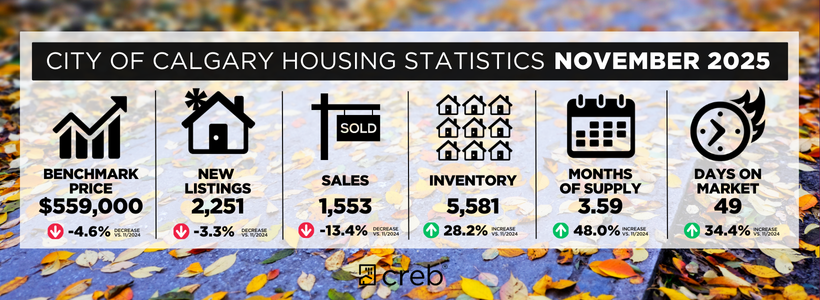
Calgary Real Estate Market Update - May 2025

Price adjustments mostly driven by apartment and row style homes

Thanks to steep pullbacks in the apartment condominium sector, total residential sales in Calgary eased by 17 per cent compared to May of last year. While the drop does seem significant, the 2,568 sales this month remain 11 per cent higher than long-term trends for May and improved over last month.

New listings continued to rise this month compared to sales, resulting in further gains in inventory levels. However, the monthly gain in both inventory and sales prevented any significant change in the months of supply compared to April. With 2.6 months of supply, conditions are still relatively balanced. 

“Compared to last year, easing sales and rising inventories are consistent trends across many cities, as uncertainty continues to weigh on housing demand. However, prior to the economic uncertainty, Calgary was dealing with seller market conditions, and the recent pullbacks in sales and inventory have helped shift us toward balanced conditions taking the pressure off prices,” said Ann-Marie Lurie, Chief Economist at CREB®. “This is a different situation from some of the other larger cities, where their housing markets were struggling prior to the addition of economic uncertainty.”    

Last year there was limited inventory across most property types and price ranges. Recent inventory gains are creating pockets of the market that are struggling with too much supply while in other areas supply levels are still low relative to the demand, resulting in divergent trends in home prices.

Both detached and semi-detached home prices have remained relatively stable this month and are still higher than last year’s levels. Meanwhile, row and apartment style homes have reported modest monthly price declines and May prices remain below last year’s levels, as improved new home and rental supply is weighing on resale prices. Overall, the total residential unadjusted benchmark price in Calgary was $589,900, slightly lower than last month and over two per cent below May 2024 levels.   

Detached

New listings in May rose to 2,419 units, with most of the gains driven by homes priced over $600,000. At the same time, sales activity has slowed across most price ranges, supporting a shift toward more balanced conditions and relative stability in prices. However, districts that are facing more competition from new home product or are seeing a larger pullback in demand are starting to show some signs of elevated supply.

The North East district has seen the largest pullback in resale sales activity combined with some of the highest gains in new listings. This has driven the sales-to-new listings ratio down to 41 per cent and the months of supply was nearly four months in May. This is causing prices to ease in the North East, offsetting some of the gains reported in the City Centre, West, and North West districts. City-wide the unadjusted benchmark price in May was $769,400, similar to last month, one percent higher than last May, and still above last year’s seasonal peak price.  

Semi-Detached

The 428 new listings in May were met with 256 sales, causing the sales-to-new-listings ratio to rise to 60 per cent this month. This slowed the pace of inventory growth and the months of supply remained just above two months.  Semi-detached homes continue to remain less than 10 per cent of all sales and inventory levels in the city.

This in part is due to construction patterns shifting toward more row style properties over semi-detached, and is one of the reasons we do not see the same inventory build as row and apartment style homes. 

Like the detached market there is significant variation within the city districts. The North East has the highest months of supply at nearly three months and is reporting some price declines, while the tightest conditions are in the North West, where prices continue to rise. Overall, generally tighter conditions are still supporting price gains for semi-detached properties. In April the unadjusted benchmark price was $697,300, a monthly gain of less than one per cent, nearly three per cent higher than last year’s levels and above last year’s seasonal peak.

Row

Row home sales have eased over last year’s near record high pace but stayed well above long-term trends.  However, the gain in new listings has continued to cause further inventory gains. For the second month in a row, inventory levels were over 1,000 units; we have not seen this much inventory for row units since 2021.

While inventory levels have improved across all districts, we are starting to see higher months of supply in the North East district at 3.5 months, resulting in some downward pressure on prices. The North, North West and South areas have also reported higher year-over-year pullbacks in resale prices, as improved supply choice for new properties are impacting resale activity. Overall, the benchmark price in May was $453,600, down over last month, nearly two per cent below last May, and lower than last year’s seasonal high.  
 

Apartment Condominium

Sales this month totaled 579 units, a significant decline over last May’s record high of 907 units. While new listings were lower than levels reported last year, they remained high compared to sales, causing the sales-to-new listings ratio to drop to 47% this month. This contributed to further inventory gains and drove the months of supply up to 3.6 months.

High levels of apartment rental units under construction are adding to the rental supply and contributing to rent adjustments. This is likely slowing condo ownership demand coming from existing renters and potential investors, contributing to some of the shifts witnessed in the apartment condominium sector. 

More supply choice is also weighing on condominium prices. In May the benchmark price eased to $335,300, down from last month and over one per cent lower than last year. The steepest declines are occurring in the North East and South East districts, where competition from the new home market is weighing on resale pricing. While prices have eased and are below peak levels, recent declines have not offset the double-digit gains reported over the past two years.

REGIONAL MARKET FACTS


Airdrie

While improving over last month, May sales eased compared to last year, contributing to the year-to-date decline of 10 per cent. However, the 772 sales so far this year are consistent with long-term trends in Airdrie. At the same time new listings continue to rise causing the sales-to-new listings ratio to fall to 58 per cent, still well within balanced conditions, but a significant change from the over 90 per cent ratio reported last year. Recent shifts in sales and new listings have supported gains in inventory levels.

In May there were 468 units in inventory, reflecting the highest May reported since prior to the pandemic. The shift in supply is in part related to the surge in new construction providing more options for potential consumers. Additional supply choice is impacting price growth.  The total residential benchmark price was $540,600 in May, down nearly one per cent over last month and nearly two per cent below last year’s levels.

Cochrane

Sales in Cochrane were fairly resilient until this month, where sales were 17 per cent slower than last year. The decline was enough to cause year-to-date sales to ease to levels just below those reported last year.  At the same time, this month new listings surged, driving the sales-to-new listings ratio down to 55 per cent and supporting further inventory gains.  With 293 units available in May, levels are more consistent with long-term trends. The months of supply neared three months in May and while this did slow the pace of price growth, the total residential benchmark price of $589,400 is still nearly four per cent higher than last May.

Okotoks

A boost in new listings this month supported a surge in sales activity. However, with a sales-to-new-listings ratio of 74%, inventory levels did not change much over last month and the months of supply once again dropped below two months. Okotoks has struggled to add supply at the pace reported in Calgary, Cochrane and Airdrie and sales growth has been dampened by limited supply choice.

While there have been some improvements in inventory levels, as of May levels remained nearly 28 per cent below long-term trends for the city.  The limited supply choice given the relatively strong demand has continue to support some price growth in the town. As of May the unadjusted benchmark price was $633,900, up over last month and over two per cent higher than last year. 

Click here to view the full City of Calgary monthly stats package.

Click here to view the full Calgary region monthly stats package.

Read

Auburn Bay Real Estate Market Update - May 2025

In May 2025, Auburn Bay experienced a noticeable slowdown in sales volume but a sharp increase in listings and inventory. This shift has begun to push the market toward more balanced conditions, especially in the apartment and detached segments.

  • Total Sales: 41 (▼20% YoY)

  • New Listings: 89 (▲27% YoY)

  • Total Inventory: 102 (▲149% YoY)

  • Months of Supply: 2.49 (▲209% YoY)

  • Benchmark Residential Price: $628,800 (▼3.7% YoY)


🏠 Performance by Property Type

🔹 Detached Homes

  • Sales: 18 units (▼25% YoY)

  • New Listings: 46 (▲15%)

  • Benchmark Price: $814,400 (▼1% YoY, slight monthly uptick)

  • Months of Supply: 2.56 (up 145% YoY)

  • Sales-to-Listings Ratio: 39% → Buyer's market pressure

  • Market Trend: Slower sales, rising inventory; sellers must be price competitive and property-ready.

🔹 Semi-Detached Homes

  • Sales: 4 units (▼33% YoY)

  • Benchmark Price: $531,600 (Flat YoY)

  • New Listings: 7 (▲17%)

  • Months of Supply: 1.5 (▲350%)

  • Sales-to-Listings Ratio: 57%

  • Market Trend: Limited inventory but sluggish buyer activity. A stable price environment, but fewer active sales.

🔹 Row Homes (Townhouses)

  • Sales: 9 units (▲50% YoY)

  • Benchmark Price: $472,000 (No YoY change)

  • New Listings: 9 (▲13%)

  • Sales-to-Listings Ratio: 100% → Balanced/Strong market

  • Months of Supply: 1.78 (▲113%)

  • Market Trend: Solid demand keeps this segment competitive; popular among downsizers and young families.

🔹 Apartments

  • Sales: 10 units (▼33% YoY)

  • Benchmark Price: $363,800 (▼5% YoY)

  • New Listings: 27 (▲69%)

  • Months of Supply: 3.4 (▲467%)

  • Sales-to-Listings Ratio: 37%

  • Market Trend: High inventory levels and price softness signal strong buyer leverage.


🏫 Schools in Auburn Bay

Auburn Bay is a family-oriented lake community with access to excellent schools:

  • Auburn Bay School (K–4) – Calgary Board of Education

  • Prince of Peace School (K–9) – Calgary Catholic School District

  • Lakeshore School (Grades 5–9) – Opened recently to serve the growing SE population

Nearby schools in Mahogany and Seton also support Auburn Bay families, offering options for French immersion and high school programs.


🌟 Community Features & Events

Auburn Bay is designed around a 43-acre freshwater lake, making it one of Calgary’s premier four-season lifestyle communities. Key features include:

  • Auburn House – The private lake-access community center with gym, rental halls, skating rinks, paddleboats, and beach access.

  • Auburn Bay Dog Park – A large off-leash area for pet owners.

  • Seton Urban District – Within minutes, offering the South Health Campus, YMCA, Cineplex, shopping, and dining.

  • Pathway Connections – Interwoven green spaces, bike trails, and parks make it an active living hub.

  • Neighbour Day BBQ (June 15): Family event with food trucks and music.


📌 Key Insights for Buyers & Sellers

✅ For Buyers:

  • Detached and apartment buyers have strong negotiating power due to rising inventory.

  • Row homes offer solid value and competition is stronger; act quickly when new listings hit.

  • Get pre-approved and work with a local expert to stay ahead of pricing shifts.

✅ For Sellers:

  • Price competitively and prepare for more Days on Market in most segments.

  • Highlight Auburn Bay lifestyle features (lake access, schools, walkability).

  • Focus on condition, staging, and professional marketing to stand out.


The Auburn Bay market in May 2025 is shifting toward balance, with increased inventory and slower sales in most segments. However, demand for affordable, lifestyle-oriented housing such as row homes remains strong. Sellers need to be strategic, and buyers have emerging opportunities — particularly in detached and apartment categories.

Read

🏡 Seton Calgary Real Estate Market – May 2025

Seton continued to show signs of vibrant activity in May 2025, with both sales volume and new listings increasing over April. The area’s modern infrastructure, access to amenities, and master-planned layout continue to draw attention from homebuyers and investors alike.

  • Total Sales: 36 homes sold in May, up from 33 in April (+9.1% M/M), marking a 50% year-over-year increase.

  • New Listings: 78 new listings entered the market in May, up from 72 in April. That’s a significant 212% Y/Y and 134% YTD increase.

  • Inventory: 134 active listings (+12.6% M/M), representing a 509% jump compared to last year.

  • Months of Supply: 3.72 (up slightly from April's 3.61), suggesting Seton is approaching more balanced conditions after a long run as a strong seller’s market.


📊 Home Prices by Property Type (May 2025)

Property TypeMay 2025 PriceMonthly TrendY/Y Change
Detached$768,300📈 Rising🔻 -1.1%
Semi-Detached$593,600📈 Steady/Rising➖ 0.0%
Row Homes$481,800📈 Rising🔼 +1.3%
Apartments$375,100📈 Rising🔼 +5.0%
Overall Price$478,500📈 Rising🔼 +1.0%

💡 Insight: Apartments led in year-over-year price growth, highlighting demand among entry-level buyers and investors. Detached homes saw a modest dip, providing a potential entry point for buyers seeking larger space in a sought-after community.


🛍️ Community & Lifestyle Highlights – Seton, SE Calgary

📰 What's New in Seton

  • Seton YMCA continues to be a major attraction, offering Calgary’s largest recreational center with pools, gyms, libraries, and art spaces.

  • Seton Urban District has expanded its dining and retail options with several new restaurants and cafés, enhancing the community's walkability.

  • The Green Line LRT Extension Project remains in progress, promising future transit convenience to downtown Calgary.

🛒 Shopping & Amenities

  • Seton Gateway Retail Plaza and South Health Campus Shopping Area offer everything from Superstore and Save-On-Foods to Shoppers Drug Mart, Cineplex VIP Theatre, and boutique local shops.

  • Future Seton Central Park is under planning, aimed at offering a central gathering space with pathways, events, and recreational facilities.


🏫 Education in Seton

  • Joane Cardinal-Schubert High School serves the community with strong academic and extracurricular programs.

  • Auburn Bay School and St. Gianna School are nearby elementary options.

  • South Health Campus also hosts training programs and continuing education via Alberta Health Services.


🎉 Community Events – May 2025

  • Seton Night Market Launch: Held every Friday in May, this event features local artisans, street food, and live music.

  • Family Fitness Day at YMCA: Free family classes, climbing wall challenges, and wellness education.

  • Community Clean-Up Drive organized by local residents brought together over 150 volunteers, showcasing strong neighborhood spirit.


🔍 Market Outlook for Summer 2025

With increasing inventory and steady new listings, Seton is expected to enter a more balanced market through summer. Demand remains healthy across all property types, particularly for affordable and well-connected housing options. Detached home pricing adjustments offer new opportunities, while apartments and row homes continue to show strong growth potential.


Seton remains one of SE Calgary’s most desirable and fastest-growing communities due to its:

  • Master-planned layout

  • Proximity to healthcare, shopping, and recreation

  • Strong transit future

  • Youthful and active lifestyle appeal

May 2025 reflected robust activity and ongoing price stability, positioning Seton as a leading choice for families, professionals, and investors alike.

Contact us for a Free Home Evaluation.
Read
Data is supplied by Pillar 9™ MLS® System. Pillar 9™ is the owner of the copyright in its MLS®System. Data is deemed reliable but is not guaranteed accurate by Pillar 9™.
The trademarks MLS®, Multiple Listing Service® and the associated logos are owned by The Canadian Real Estate Association (CREA) and identify the quality of services provided by real estate professionals who are members of CREA. Used under license.