RSS

May Real Estate Market Report: Apartment prices ease as inventory remains elevated

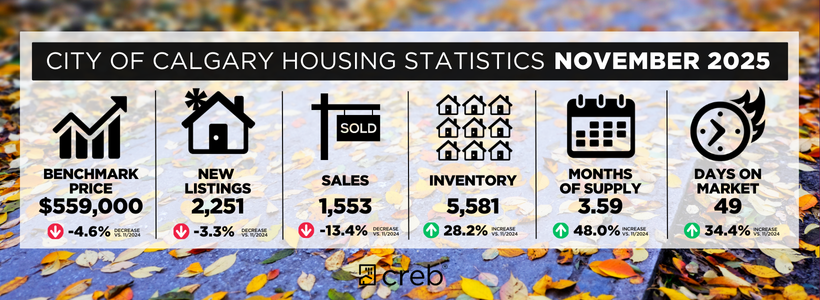
In line with seasonal trends, inventory has risen from the start of the year, reaching 6,752 units in May. While these levels are consistent with last May, they remain 11 per cent higher than longer-term trends for the month, thanks to higher supply levels of apartment and row-style homes. Meanwhile, inventory levels for detached homes are down three per cent compared with both last year and long-term trends. 

At the same time, sales activity has been slowing. Calgary sales in May were 2,162 units, 16 per cent lower than last year’s levels and similar to sales reported in April. While new listings also slowed by 13 per cent compared with last year, it was not enough to offset the pullback in sales, causing the sales-to-new-listings ratio to ease to 51 per cent. The lower ratio also contributed to some of the inventory build, causing the months of supply to rise. However, conditions do vary across the market, with a range of two-and-a-half months of supply in the detached market to more than five months of supply in the apartment condominium market.    

“The shift in supply is being felt in the market. More supply choice in the new and rental markets has created a more competitive environment for potential buyers. At the same time, concerns over rising cost of living and slower migration are also weighing on consumers,” said Ann-Marie Lurie, Chief Economist at the Calgary Real Estate Board (CREB®). “While this has caused the overall resale market to shift to a balanced state, the supply pressure is having a more prevalent impact for apartment-style units, where conditions are favouring the buyer. This is also impacting price movements, with apartment prices continuing to trend down and other property types reporting a seasonal lift over the winter months.”  

The unadjusted total residential benchmark price in May was $570,500, up over April’s levels and the $554,400 reported in January, but still three per cent lower than last May. Most of the unadjusted monthly gain was driven by detached homes, which rose from $724,000 in January to $747,800 in May. Apartment prices remain lower than January levels and are nine per cent lower than levels reported last May. Overall, when adjusting for seasonality, total residential prices have remained relatively stable, as detached improvements have offset pullbacks for apartment-style homes.

Detached

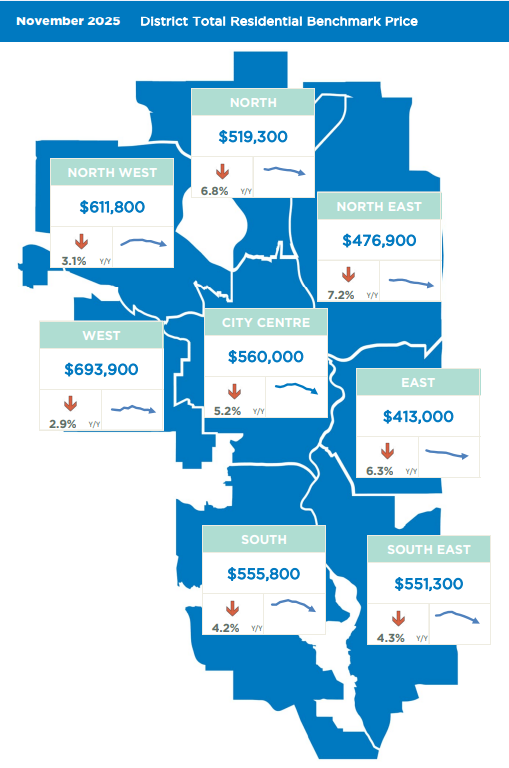
Detached new listings reached 2,195 units in May compared with 1,192 sales, causing the sales-to-new-listings ratio to ease to 54 per cent compared to the higher levels reported over the past three months. This supported a monthly lift in inventory levels, but supply remained three per cent lower than levels reported last year at this time. With two-and-a-half months of supply, conditions remain relatively balanced and are supporting stability in seasonally adjusted prices. Within the detached market, there is some significant variation. While year-to-date sales have slowed by four per cent, there have been gains for the lowest-priced (under $600,000) and highest-priced ($1.5 million and up) homes. Within each district, conditions ranged from a seller’s market in the West district to a buyer’s market in the North East district. The variation is also impacting price movements. The North East district is reporting the highest year-over-year decline at seven per cent. Meanwhile, thanks to recent gains, the West district has seen prices remain consistent with levels reported last year.

Semi-Detached

Both sales and new listings in May remained at levels similar to the previous month. With 217 sales and 375 new listings, the sales-to-new-listings ratio was 58 per cent, supporting some modest improvements in inventory levels. Despite inventory improvements, conditions remained relatively balanced, with months of supply sitting at just under three months. Unadjusted benchmark prices continued to rise in May, reaching $691,100. This is an improvement over the $667,000 reported in January, but still one per cent lower than levels reported in May 2025. Like the detached sector, conditions vary significantly across the city. Prices have been trending up across most districts. Meanwhile, year-to-date new record-high prices have been reported in the North West and West districts. 

Row

Following April’s gains, May sales slowed, adding to the year-to-date decline of 16 per cent. The 350 sales were met with 695 new listings, causing the sales-to-new-listings ratio to fall to 50 per cent in May. This also resulted in slight gains in inventory levels, pushing the months of supply up above three months. While there is more supply compared to several years ago, prices have still reported some modest gains compared with earlier in the year. The unadjusted benchmark price was $422,300 in May. Prices have improved since the beginning of the year, but remain over six per cent lower than last year’s levels. The largest year-over-year declines occurred in the North East and East districts, where prices fell by more than 10 per cent. The West district reported the smallest decline at nearly four per cent. 

Apartment Condominium

Additional supply choice in the rental and new-home markets is heavily weighing on resale condominiums. Sales continued to slow into May, contributing to a year-to-date decline of nearly 28 per cent. At the same time, while new listings are not as high as last year, the 403 sales compared to 961 new listings caused the sales-to-new-listings ratio to fall to 42 per cent, keeping inventories elevated. With supply levels remaining elevated and demand easing, the months of supply has pushed above five months, creating conditions favourable to buyers. The excess supply is also weighing on prices, as the unadjusted benchmark price continues to decline. In May, the unadjusted benchmark price was $300,400, lower than January levels and nine per cent below last year’s price. Prices have eased across each district, with double-digit declines occurring in the North East, North, and East districts. The lowest price decline occurred in the North West district at six per cent.    

Read

April Housing Market Report — Balanced conditions in the city, except for apartment-style units

Calgary, Alberta, May 1, 2026 – In line with seasonal expectations, both sales and inventory levels trended up relative to March’s activity. Despite this typical monthly rise, April sales totalled 2,104 units, six per cent lower than levels reported in 2025. 

“Sales were expected to ease this year as our market transitioned away from strong demand that was driven by previously rapid migration growth. Improved supply choice across the entire housing spectrum has reduced the urgency among potential purchasers, helping our market shift away from seller’s market conditions to more balanced conditions,” said Ann-Marie Lurie, CREB®’s Chief Economist. “However, the trend of limited supply choice in the detached market continues, while conditions favour the buyer in the apartment condominium market.” 

With 3,829 new listings in April, the sales-to-new-listings ratio remained at 55 per cent, supporting a modest monthly gain in supply. Inventory levels reached 5,973 units, nearly two per cent higher than levels reported last April. Overall, the months of supply remained just below three, representing relatively balanced conditions. However, this ranged from just over two months for detached homes to over four months for apartment-style homes. 

The unadjusted total residential benchmark price trended up compared with March, reaching $568,800. The monthly gain was mostly associated with seasonal improvements, which is expected heading into the spring market. Monthly gains were higher in the detached and semi-detached segments. Overall, compared with the previous year, prices remain three per cent lower, with modest year-over-year declines in the detached and semi-detached sector, while declines neared nine per cent for apartment-style units.   

So far in 2026, conditions have varied, ranging from seller’s market conditions and price growth for detached homes in some parts of the city to buyer’s market conditions and price adjustments in the apartment condominium sector.

Detached

With 1,095 sales and 1,863 new listings, inventory levels reported a modest monthly gain. However, with 2,468 units in inventory, levels remain lower than those reported last year and below long-term trends, while months of supply remained just over two. The tighter conditions helped support prices in April, which continued to rise compared with March, causing the pace of year-over-year price declines to ease to under three per cent. As of April, the unadjusted benchmark price was $745,400. Within the detached market, conditions varied by district. Calgary’s North West, West and South districts experienced seller’s market conditions, with less than two months of supply, driving stronger monthly price gains. Meanwhile, conditions in the North East favoured the buyer, causing prices to trend down from the previous month. Benchmark price changes in April ranged from a year-over-year decline of eight per cent in the North East to a two per cent increase in the West district. 

Semi-Detached

Recent improvements in new listings helped to support the rise in sales this month. Year to date, there have been 700 sales and 1,190 new listings, similar to last year’s levels. In April, both the sales-to-new-listings ratio and months of supply remained at the lower end of the balanced range. Conditions supported further monthly price growth, as the unadjusted benchmark price reached $690,000. Gains over the past three months have brought prices to levels only slightly lower than those reported last April. As in the detached sector, conditions vary by location. In April, prices trended up over March in all districts except the North East and East, which are also reporting higher months of supply. Tighter conditions in other areas supported monthly price gains. Year to date, benchmark prices improved over last year’s levels in the City Centre, North West and West districts. 

Row

Sales, new listings and inventory levels all trended over the previous month, in line with seasonal expectations. However, year to date, the pullback in sales has outpaced the pullback in new listings, causing the sales-to-new-listings ratio to average 51 per cent and inventories to trend higher than levels reported last year at this time. While inventories have improved, months of supply has remained in a relatively balanced range at nearly three months. Conditions vary significantly across the city, contributing to differing price trends. The North East district reported the highest months of supply and the steepest year-to-date price adjustments, at over 11 per cent. Meanwhile, the smallest year-to-date price adjustments occurred in the West, at less than a two per cent decline.

Apartment Condominium

The pace of growth in new listings slowed in April relative to the gains in sales, causing the sales-to-new-listings ratio to improve to 46 per cent. However, this is not enough to prevent further inventory gains. In April, inventory rose to 1,920 units, nearly three per cent higher than last year and 27 per cent above long-term trends. With over four months of supply, conditions continue to favour the buyer, preventing any significant upward pressure on prices. As of April, the unadjusted benchmark price was $301,400, slightly higher than March. Gains were mostly driven by improvements in the North West, South East and West districts, while prices continued to trend down in the North East, North and East districts. Compared with last April, benchmark prices have declined by nearly nine per cent, with the steepest declines in the North East, East, North and South East districts. 

Read

Calgary Latest Real Estate Report - Trends differ based on property type

Supply conditions in March varied significantly depending on property type. Inventory levels saw a typical monthly rise, but compared with long-term trends, inventory remained well above the 10-year average for both row and apartment-style units and well below trend for detached homes. This is not a surprise given the pullback in detached housing starts last year despite record-high apartment-style starts. 

There were 1,881 sales in March, up from the previous month, but still 13 per cent lower than levels reported last year and below long-term trends for March. The decline in sales is mostly due to pullbacks in apartment-style activity, where increased supply choice and slower migration is spreading demand across a wider range of supply. Meanwhile, detached sales have also slowed compared to long-term trends, likely due to limited supply choice in some city districts. 

“When considering total residential housing statistics, conditions appear to be relatively balanced as sales, new listings, inventories and prices all trended up over the previous month as we start to move into the spring market,” said Ann-Marie Lurie, CREB®’s Chief Economist. “However, when we look deeper, we are seeing a market that ranges from tighter conditions for detached homes to the apartment sector, where conditions tend to favour the buyer. As expected, this is supporting upward momentum in detached prices and downward pressure in the apartment condominium sector.” 

The total unadjusted benchmark price in the city was $565,600, up nearly one per cent compared to February but down by more than four per cent compared to last year. After the first quarter, benchmark prices posted modest to stable conditions for lower density homes. However, apartment condominium prices continued to slide, dropping another three per cent in the first quarter compared to the fourth quarter of last year.

Detached

The detached market is exhibiting the tightest conditions compared to all other property types. With 982 sales and 1,614 new listings in March, the sales-to-new-listings ratio rose to 61 per cent, while inventory levels remained similar to those reported last year. With just over two months of supply, conditions in March closely resembled those seen last year at this time. However, conditions varied across the city, with less than two months of supply reported in the North West, West, South, South East and East districts. Meanwhile, conditions were relatively balanced in both the City Centre and North districts, while the North East district continues to struggle with higher supply relative to demand. The detached benchmark price was $741,300 in March, down by three per cent over last year’s peak price of $766,600. However, tight conditions in most parts of the city are driving some price gains. After the first quarter, the largest quarterly gain was reported in the West district, followed by the City Centre and South districts. 

Semi-Detached

Semi-detached sales rose over last year’s levels for the second consecutive month, supported by improvements in new listings and inventory levels. With 480 units in inventory and 193 sales, both levels are comparable to long-term trends and conditions remain relatively balanced. As of March, the unadjusted benchmark price was $686,100—slightly higher than last month and only one per cent lower than last year’s levels. Like other property types, there remains a range in price movements dependent on location. By the end of the first quarter, prices have trended up across most districts, but year-over-year prices remain below last year’s levels in all districts except the City Centre, North West and West districts.

Row

Row home sales continue to slow compared to last year in March, contributing to a first-quarter decline of 19 per cent. The 778 sales in the first quarter were met with 1,581 new listings, keeping the sales-to-new-listings ratio just below 50 per cent and supporting further inventory gains. In March, there were 960 units in inventory — 25 per cent higher than long-term trends — causing the months of supply to rise to nearly three months. While the row market is relatively balanced in most areas of the city, conditions are favouring the buyer in the North East districts. As of March, the unadjusted benchmark price in the city was $423,900, similar to last month and over six per cent lower than levels reported last year. After the first quarter, benchmark prices remain relatively comparable to levels reported in the previous quarter, as quarterly losses in the North East, North, South East and East districts offset the gains reported in the City Centre and West districts.

Apartment Condominium

Supply levels continue to rise for apartment-style units. With 1,774 units in inventory, levels are just shy of the record high for the month reported during the financial crisis in 2008. New supply growth, along with a sharp pullback in sales relative to new listings, has contributed to the rise in resale inventories. With the sales-to-new-listings ratio hovering around 40 per cent and nearly five months of supply, it is not surprising that prices struggle to improve. As of March, the unadjusted benchmark price was $300,300 — slightly higher than last month but over nine per cent lower than last year’s levels. After the first quarter of this year, apartment prices have eased by nearly three per cent compared with the fourth quarter of last year. While prices eased across all districts, the largest declines occurred in the South and North districts, both exceeding four per cent. 

Read

February Housing Market Report — Detached market tightens while apartments remain oversupplied

Calgary continued to see market conditions vary by property type in February. The tightest conditions occurred in detached and semi-detached properties, reporting less than three months of supply. Row homes reported slightly higher supply levels relative to demand but remained relatively balanced. Meanwhile, apartment-style properties are dealing with excess supply, as conditions continue to favour the buyer. 

“Slowing migration levels are coming at a time when supply for apartment-style homes is rising. Calgary reported record high starts last year, mostly due to gains in apartment starts where there are nearly 18,000 units currently under construction. While a large share of the units is targeted for rental, this also impacts condo ownership markets,” said Ann-Marie Lurie, CREB®’s Chief Economist. “Meanwhile, on the opposite end of the spectrum, the detached market remains relatively balanced in the higher price ranges and continues to struggle with limited supply for homes priced below $700,000.” 

Tighter conditions for detached homes offset the higher supply levels in the apartment condominium sector, leaving citywide conditions relatively balanced at three months of supply and a sales-to-new-listings ratio of 55 per cent. Inventory levels reached 4,822 units in February, with condominiums and row homes representing more than half of all the inventory. At the same time, there were 1,526 sales in February, an 11 per cent decline over last February, mostly due to a sharp pullback in row and apartment sales. 

Typical seasonal patterns tend to drive monthly gains in prices early in the year following the monthly slides reported at the end of the previous year. While February did report monthly benchmark price gains for most property types, prices continued to slide for apartment-style homes. However, monthly gains for lower-density homes offset the pullbacks for apartment units, leaving the total residential benchmark price of $560,500 one per cent higher than January, but still four per cent lower than last year's levels. 

Detached

Both sales and new listings in February were similar to levels reported last year. With 736 sales and 1,269 new listings, the sales-to-new-listings ratio was 58 per cent. While this did not prevent further inventory gains, months of supply remained relatively balanced at just under three months. Conditions did vary across the city as the North East district struggled with excess supply, preventing any improvement in monthly prices. Meanwhile, the West district reported the tightest conditions with less than two months of supply. 

In February, the unadjusted benchmark price for a detached home was $734,300, over one per cent higher than January, but still three per cent lower than last year's levels. The only districts to report both month-over-month and year-over-year gains were the City Centre and the West district. 

Semi-Detached

Sales improved in February, reaching 175 units. At the same time, new listings rose to 253 units, causing the sales-to-new-listings ratio to rise to 69 per cent and preventing any improvement in inventory levels compared to January. This caused the months of supply to drop to 2.4 months, the lowest out of the four property types. 

While this is a smaller segment of the market, the tighter conditions did result in slightly higher monthly price gains. As of February, the unadjusted benchmark price was $682,200, over two per cent higher than January and comparable to levels reported last year. Year-over-year price changes varied by district, with gains in the City Centre, North West and West offsetting declines in the North East, North, South, South East and East. In addition to typical seasonal factors, tighter conditions at the start of the year are helping support monthly price gains in most districts. 

Row

Sales picked up in February compared to January, reaching 270 units. Meanwhile, after January’s surge in new listings, levels slowed to 491 units, helping bring the sales-to-new-listings ratio into more balanced territory at 55 per cent. While inventories did rise, the monthly gains in sales helped reduce the months of supply from over four months in January to just over three months in February. 

The unadjusted benchmark price rose to $423,600 in February, in line with typical seasonal expectations. While prices are still five per cent lower than last February, there is significant variation between districts. The steepest year-over-year declines have occurred in the North East and East districts at over 10 per cent. Meanwhile, prices in both the West and City Centre are only slightly lower than levels reported last February. 

Apartment Condominium

Despite a pullback in new listings in February, with 753 new listings and 345 sales, the sales-to-new-listings ratio remained low at 46 per cent, contributing to further inventory gains. February reported 1,580 units in inventory, high enough to keep the months of supply well over four months. The persistently higher supply levels continued to weigh on prices in February, as the monthly benchmark price dropped to $298,600, nearly one per cent below January and over nine per cent lower than prices reported last February. 

Conditions do vary across the city. After the first two months of the year, the months of supply have ranged from over 11 months in the North East to below four months in the South district. The higher supply levels are weighing on prices across all districts. The largest year-over-year price adjustments have occurred in the North East, East and South East districts, which have seen declines surpassing 10 per cent. 

Read

January Housing Market Report -- Slow start for high-density homes

Calgary reported 1,234 sales in January, a year-over-year decline of 15 per cent, but in line with typical levels of activity for the month. While sales declined across all property types, the steepest declines occurred in higher-density homes. 

“Following the typical December slowdown, potential buyers for high-density homes were more hesitant to return to the market in January, as increased supply choice across all aspects of the market has reduced the sense of urgency,” said Ann-Marie Lurie, CREB®’s Chief Economist. “At the same time, sellers were quick to bring their listings onto the market, causing the sales-to-new-listings ratio to drop to 44 per cent, mostly due to shifts in apartment and row-style homes. Overall, this is not entirely uncommon for January, as both buyers and sellers weigh their options ahead of the spring market.” 

The rise in new listings compared to sales caused inventory levels to increase to 4,391 units, the highest January level since 2020. However, as with sales, conditions vary by property type, with row and apartment homes facing higher levels of inventory compared to long-term trends. The result is months of supply that ranges from under three months in the detached sector to five months for apartment-style homes. 

Due to declines in the later part of 2025, benchmark prices are lower than levels reported at the start of last year. However, seasonally adjusted figures point to stable levels in January compared to the end of 2025. Nonetheless, year-over-year total residential benchmark prices have declined by nearly five per cent, as steep declines reported in the oversupplied row- and apartment-style homes weighed on total residential prices compared to last year.

Detached

There were 657 sales and 1,243 new listings in January, comparable to levels reported last year. However, new listings did rise over December levels, causing inventories to reach 1,753 units, just shy of long-term averages for the month. With less than three months of supply and a sales-to-new-listings ratio of 53 per cent, conditions remained relatively balanced in the detached market. 

The January unadjusted benchmark price was $724,000, slightly lower than the previous month and over three per cent lower than last January, as prices trended down over the second half of 2025. Price movements varied throughout the city, with year-over-year declines ranging from less than one per cent in the West district to over six per cent lower in the North East. While unadjusted prices did ease over December, this was mostly due to pullbacks in the City Centre and North West districts.

Semi-Detached

There were 118 sales in January and 251 new listings, representing 10 per cent of the market activity in the city. While both sales and new listings improved over December, the growth in new listings was higher, causing the sales-to-new-listings ratio to ease to 47 per cent. Inventory levels improved but conditions remained relatively balanced, with three and a half months of supply.  

Rising supply, which started in the latter part of 2025 and continues into 2026, is creating more price stability. As of January, the benchmark price was $667,000, similar to last month and only one per cent lower than last January. Year-over-year prices in both the North West and West districts remain higher than last year but are lower in every other district.

Row

There were 186 sales in January, down by nearly 25 per cent compared to last year. Meanwhile, supply continued to rise both in terms of new listings and inventory growth, causing the months of supply to push above four months. 

Despite the added supply, the unadjusted benchmark price remained similar to December's levels, but was five per cent lower than last January. The month-over-month stability was due to gains in the City Centre and West districts. Year-over-year price adjustments have been the highest in the North East and East districts, followed by the North and South East districts, which have faced significant competition from the new-home market. 

Apartment Condominium

Apartment-style units continue to struggle with supply. New listings reached 787 units, which is not as high as last year but a significant jump over December and much higher than the 273 sales reported in January, pushing the sales-to-new-listings ratio down to 35 per cent. This drove further gains in inventory, which reached 1,435 units, the highest levels ever reported for January. 

With over five months of supply in January, it is not surprising that prices trended down further. The unadjusted benchmark price was $301,200, nearly one per cent lower than the previous month and eight per cent lower than last January. Prices have been falling across every district, with year-over-year declines ranging from 13 per cent in the North East to six per cent in the City Centre.

Read

Calgary Latest Real Estate Market update - Dec. 2025

Following several years of strong price growth, 2025 marked a year of transition thanks to strong demand and limited supply. Due to record high starts, supply levels improved across all aspects of the housing market, just as demand pressure eased due to a reduction in migration levels and heightened uncertainty that persisted throughout the spring market. This helped shift the resale market from one that favoured the seller to one that was more balanced. 

In 2025, sales reached 22,751 units, down 16 per cent over last year, but in-line with long-term trends. Much of the shift came from the growth in supply. 2025 saw over 40,000 new listings come onto the market, nine per cent higher than last year, causing inventories to rise and driving more balanced conditions. 

“Supply levels were expected to rise in 2025. However, the growth was higher than expected especially for apartment condominium and row homes. This weighed on prices in those sectors enough to offset the annual gains reported for both detached and semi-detached homes,” said Ann-Marie Lurie, CREB®’s Chief Economist. "Adjustments in both supply and demand varied across the city, with pockets of the market continuing to experience seller’s market conditions versus some areas where the conditions favoured the buyer. This resulted in different price trends based on location, price range and property type.” 

Overall, the annual average total residential benchmark price in 2025 was $577,492, two per cent lower than last year’s annual average. However, annual detached and semi-detached prices rose by a respective one and three per cent, while apartment and row homes saw prices fall by a respective three and two per cent. 

Compared to other districts, the North East reported the largest decline in prices this year. While some of this is related to improved supply across all areas of the city, it is also important to note that the North East district also reported the strongest price growth over the past two years. 

Detached

Detached sales totaled 11,328 in 2025, down by nearly nine per cent compared to last year. Sales eased across all districts in the city, with the steepest declines occurring in the North East, East and City Centre district. However, unlike the City Centre, the North East and East districts also experienced significant gains in inventory compared to long-term trends, driving annual price declines of two per cent. Meanwhile, in the City Centre detached inventory remained well below long-term averages, which likely prevented stronger sales and contributed to the annual price growth of over three per cent. Despite the differing conditions in different areas of the city, slowing sales and rising supply citywide helped move the market into balanced conditions by the second half of the year. The annual average benchmark price was $752,767, one per cent higher than last year’s annual level.  

Semi-Detached

Semi-detached homes represent the smallest segment of the market, accounting for less than 10 per cent of all sales activity. Sales in 2025 were 2,159, eight per cent lower than last year, but slightly higher than long-term trends. Trends for semi-detached homes have been relatively consistent with the detached market. However, it took longer for this segment of the market to shift to more balanced conditions, resulting in stronger annual price gains. In 2025, the average annual benchmark price was $685,850, nearly three per cent higher than last year. Prices did ease in the North district as competition for new homes weighed on resale activity, but the decline in this district was more than offset by the four per cent gain in the City Centre. 

Row

2025 sales eased by 17 per cent to 3,838 units. Despite the decline, sales were still higher than long-term trends, as row homes are starting to account for a larger share of the overall activity in the city. At the same time, new listings also rose relative to sales, driving inventory gains and taking the pressure off prices. Conditions shifted to more balanced levels relatively early in the year, and by the last quarter conditions ranged from a balanced to a buyer’s market depending on the districts of the city. Overall, this contributed to the annual average benchmark price decline of two per cent. While prices were relatively stable in the City Centre, North West, West  and East districts, additional supply in the resale market and competition from new homes caused prices to decline by four per cent in the North East and North districts.

Apartment Condominium

Apartment-style homes reported the largest adjustment in price in 2025. Sales declined by 28 per cent compared to the near record high levels achieved last year. While the decline was significant, sales were still over 28 per cent higher than long-term trends. The main cause of the shift in conditions was due to the supply. Over the past three years, there has been a rise in apartment-style starts. While most of the apartment starts were purpose-built rental, they are adding to the supply choice and weighing on the resale market. Resale condominiums saw the market shift in favour of buyers by the second half of the year, with elevated months of supply being reported in most districts of the city. This resulted in relatively persistent downward pressure on prices, causing the annual average benchmark price to decline by nearly three per cent. Price declines were the steepest in the North East nearing five per cent. The only area to report relative stability in the annual price was in the West district.

Read

NOV 2025 - Calgary Latest Real Estate Market Report

In line with typical seasonal trends, sales, new listings and inventory levels all slowed relative to last month. The 1,553 sales were met with 2,251 new listings, causing the sales-to-new-listings levels ratio to improve to 69 per cent. This also helped support some of the inventory adjustment. However, with 5,581 units in inventory, levels are still 28 per cent higher than last year and over 15 per cent higher than typical levels reported in November. 

“Supply levels have been sitting higher than typical levels for the past three months, mostly due to the gains occurring in the higher-density sectors of row and apartment style units,” said Ann-Marie Lurie, CREB®’s Chief Economist. “This is partially related to the additional supply choice coming from the new homes sector, some of which end up on the resale market, especially near the end of the year. While buyer’s market conditions are more prevalent for apartment-style homes and to a lesser extent row homes, outside of a few pockets of the market, both the detached and semi-detached markets are relatively balanced.”   

The additional supply choice across resale, new and rental markets, is having the most impact on apartment and row style home prices which are reporting year-over-year price declines of seven and six per cent. In comparison detached home prices are down by two per cent compared to last November, but still higher than last year when looking at year-to-date figures. Overall, the unadjusted total combined residential benchmark* price in November was $559,000, nearly five per cent lower than last year. 

*To keep the benchmark price relevant, once a year the attributes of a benchmark home are reviewed and the benchmark prices are updated. The review has been completed and the data has been updated.  While all historical adjustments have occurred, old PDF monthly reports are not adjusted. 

Detached

Detached sales in November were 823 units, just slightly lower than last year’s level, and relatively consistent with activity reported for November. The monthly reduction in new listings helped push down inventory levels compared to last month, but inventory remained well above the lower levels reported last year and are now relatively consistent with long-term trends. Overall, the months of supply remained around three months, reflecting a relatively balanced condition. Despite this we did see unadjusted prices trend down over last month, mostly reflecting seasonal patterns. As of November, the unadjusted detached benchmark price was $733,000, down by nearly two per cent compared to last November. However, when considering the year-to-date figures, prices are still one per cent higher than last year. Most of the downward price adjustments have occurred in the North East, North and East districts as competition from new homes and additional supply choice in other parts of the city are more heavily weighing on those districts.   

Semi-Detached

Sales in November were comparable to levels reported last year and still well above long-term trends, but with new listings also higher than typical levels for this time of year, inventories rose to the highest November level seen over the past five years. While conditions have been generally tighter for this property type, over the past three months we have seen the months of supply remain above three months, resulting in more balanced conditions. While the unadjusted benchmark price of $671,700 did ease over last month, it remained stable compared to last year. Year-to-date price growth has been the strongest in this sector at nearly three per cent, with the largest gains occurring in the City Centre at four per cent, partially offsetting the one per cent pullback in the North district. 

Row

November sales eased to 257, however, last year was a record high for the month and current sales remain above long-term trends. Where there continues to be more notable shifts is in supply. New listings remained comparable to last year and inventories, while reporting the typical seasonal decline, were at November levels not seen since 2018. The additional supply has caused the months of supply to remain slightly elevated, especially over the past three months. This has been placing some downward pressure on prices. In November, the unadjusted benchmark price was $424,400, down over last month and over six per cent lower than last year. While some of the monthly decline is seasonal, more persistent price declines have caused the year-to-date price to fall by nearly two per cent. 

Apartment Condominium

This sector has struggled the most with excess supply. November sales dropped to levels consistent with long-term trends, but new listings remained elevated and November inventory levels hit a record high for the month. The months of supply edged near six months and has been sitting above four months since the summer. This has resulted in relatively persistent price adjustments throughout the second half of the year and as of November the unadjusted benchmark price was $309,300, seven per cent lower than last year at this time. Year-to-date the decline was just over two per cent, with the largest decline occurring in the North East district at nearly five per cent. The only district to see prices remain flat was the West district.

REGIONAL MARKET FACTS


Airdrie

As per typical seasonal behaviour, sales, new listings and inventory levels all eased over levels reported last month. Overall, both sales and new listings have remained at levels consistent with long-term trends for the month, but thanks to earlier gains inventory levels remain elevated for November. Some of the rise is due to a higher share of newer homes coming onto the resale market. The additional supply over the past several months has weighed on prices in Airdrie. While it has by no means offset the gains reported over the past four years, year-to-date benchmark prices for detached homes are down by nearly one per cent compared to last year. 

Cochrane

The seasonal monthly pullback in new listings was not enough to prevent November levels from reaching a record high. While sales also remained relatively strong for November, it was not high enough to cause a more significant monthly pullback in inventories, which have not been this high in November since 2018. Some of the gains in new listings were due to a larger share of new homes being listed on the resale market. While recent gains in supply have caused some adjustments in price, prices continue to remain higher than levels reported last year. Year-to-date detached benchmark prices are nearly two per cent higher than levels reported last year.

Okotoks

Unlike other areas, sales in Okotoks improved compared to last month and were similar to levels reported last year. This in part could be related to the higher level of new listings that were available both in November and October, providing more choice to potential buyers. The Okotoks market has seen some recent gains in inventory levels, but overall supply remains well below long-term trends. Conditions have remained relatively tight in the Okotoks market and, despite some recent adjustments in prices, overall prices are still higher than last year on a year-to-date basis across each property type.

Contact us for a Free Home Evaluation.

Read

Pace of new listings growth slows, preventing further inventory gains - Oct 2025

Inventory levels eased over last month thanks to the combined impact of a monthly pullback in new listings and a monthly pick up in sales. With 6,471 units in inventory and 1,885 sales the October months of supply returned to three-and-a-half months after pushing up to four months in September. While both row- and apartment-style properties continue to report elevated supply levels compared to demand, conditions remain relatively balanced for both detached and semi-detached properties. 

Year-to-date sales in the city totaled 20,082, down nearly 16 per cent compared to last year, but still in line with longer-term trends. Much of the decline in sales has been driven by pullbacks for apartment- and row-style homes.   

“Improved rental supply and easing rents have slowed ownership demand for apartment- and row-style homes. It is also these segments of the market that have seen October inventories reach a record high for the month,” said Ann-Marie Lurie, CREB®’s Chief Economist. “Excess supply for apartment- and row-style properties is weighing on prices in those segments more so than any other property type, influencing total residential prices.” 

As of October, the total unadjusted residential benchmark price in Calgary was $568,000, down nearly one per cent compared to last month and over four per cent lower than last year’s levels. The largest price adjustments occurred for row- and apartment-style properties where prices have eased by a respective six and seven per cent compared to last October. 

Detached

October sales reached 1,012 units, an improvement over last month, but still five per cent lower than last year’s levels. At the same time there were 1,593 new listings that came onto the market, causing the sales-to-new-listings ratio to rise to 64 per cent and inventories to trend down over last month to 2,913. Inventory levels remain slightly higher than long-term trends for the month, but with just under three months of supply, conditions remain relatively balanced and far better than conditions reported during the 2015 to 2019 period.

Despite relatively balanced conditions, there are pockets of the market that are experiencing buyer’s market conditions, which is impacting prices. Citywide detached benchmark prices eased to $744,400 in October, one per cent lower than last year. However, price adjustments ranged from a year-over-year gain of nearly two per cent in the City Centre to a decline of over five per cent in the North East district. Despite recent adjustments, year-to-date prices remain over one per cent higher than last year.  

Semi-Detached

Sales improved over last month while new listings slowed, causing the sales-to-new-listing ratio to rise to 57 per cent, which is slightly lower than typical levels for this time of year, but high enough to prevent any significant change in inventory levels compared to last month. With 186 sales and 613 units in inventory, the months of supply was over three months, higher than last year’s extremely low levels, but lower than last month.

More inventory choice has weighed on prices over the past several months. However, with an October benchmark price of $683,100, prices remain nearly one per cent higher than last year and on a year-to-date basis are over three per cent higher than last year. 

Row

With 275 sales in October, year-to-date row sales totaled 3,412 units, a 17 per cent decline over last year. While row sales remain well above long-term trends, new listings have been on the rise and reached record highs so far this year. As of October, there were 1,054 units in inventory, the highest ever reported for the month and nearly 32 per cent higher than long-term averages. This also caused the months of supply to remain around four months.

The additional supply choice has weighed on prices. The October benchmark price was $431,200, over one per cent lower than last month and nearly six per cent lower than prices reported last year at this time. The steady slide in row prices have caused year-to-date prices to drop by one-and-a-half per cent. Price adjustments did vary across the city with the largest year-to-date declines occurring in the North East and North districts. 


Apartment Condominium

The pullback in new listings relative to sales this month did help prevent further gains in inventory levels. However, with 1,891 units in inventory and 412 sales, the months of supply remained elevated at nearly five months. Apartment condominiums have been experiencing buyer’s market conditions for nearly 6 months, placing downward pressure on prices. As of October, the benchmark price was $318,200, down over one per cent compared to last month, and nearly seven per cent lower than last October.

On a year-to-date basis, prices are nearly two per cent lower than last year’s levels. The largest year-to-date price declines occurred in the North East and South East districts at four per cent, as those districts are either reporting the highest months of supply on the resale market or are facing significant competition from the new home market.

REGIONAL MARKET FACTS


Airdrie

Activity slowed as we moved into October. While sales have remained consistent with longer-term trends, new listings reached a record high for October, keeping inventories elevated. With 535 units in inventory and 136 sales, the months of supply remained over four months. The persistently higher months of supply over the past four months, combined with additional supply choice in the new home market, has weighed on resale home prices. Prices in Airdrie have been trending down since April of this year and as of October the benchmark price was $520,400, nearly one per cent lower than last month and nearly five per cent lower than last year’s levels. 

Cochrane

Sales in Cochrane improved this month, keeping year-to-date sales at levels that are relatively consistent with last year. At the same time, while levels remained high, new listings did trend down over last month, causing the sales-to-new-listings ratio to rise to 55 per cent and preventing any further gains in inventory levels. The months of supply eased to just over four months in October, higher than the low levels reported over the past several years, but relatively more consistent with long-term trends for the month. As of October, the benchmark price was $585,200, similar to last month and over two per cent higher than last year. Year-to-date prices in the area have risen by nearly four per cent. Some of the gain in prices could be related to a larger share of new homes ending up being sold on the resale market in Cochrane. 

Okotoks

October reported 91 new listings on the market, a significant gain over last month and last year’s levels. The rise in new listings was met with slower sales activity, causing the sales-to-new-listings ratio to dip below 50 per cent, supporting a modest gain in inventory levels. While inventory levels are finally improving, they remain low relative to longer-term trends. This has likely prevented a more significant shift in prices in the Okotoks area. In October, the unadjusted benchmark price was $618,600, up over last month but consistent with last October. Year-to-date benchmark prices have improved by over one per cent. 

Contact us for a Free Home Evaluation.

Read

SEPTEMBER 2025 HOUSING MARKET UPDATE

A boost in new listings drives further inventory gains and price adjustments

The 1,720 sales in September were not high enough to offset the 3,782 new listings coming onto the market, driving further inventory gains as we move into the fall. There were 6,916 units in inventory in September, 36 per cent higher than last year and over 17 per cent higher than levels traditionally reported in September. Both row and apartment style homes have reported the largest boost in supply compared to long-term trends. 

“Supply levels have been rising in the resale, new home and rental markets. The additional supply choice is coming at a time when demand is slowing, mostly due to slower population growth and persistent uncertainty. Resale markets have more competition from new homes and additional supply in the rental market, reducing the sense of urgency amongst potential purchasers. Ultimately, the additional supply choice is weighing on home prices,” said Ann-Marie Lurie, CREB® Chief Economist. 

Supply levels relative to demand typically drive shifts in home prices. In September, the sales to new listings ratio dipped to 45 per cent, and the months of supply pushed up to four months for the first time since early 2020. This is a higher level of supply compared to demand than is typically seen in the Calgary market and, should this persist, we could see a market that shifts more in favour of the buyer. However, conditions do vary by property type, price range and location. 

Inventory gains for apartment style homes over the past several months have contributed to buyer market conditions in this segment, driving year-over-year price adjustments of over six per cent for a total benchmark price of $322,900 in September. While the detached segment has also seen a rise in the months of supply, it has not been as high as the apartment condo sector. At a benchmark price of $749,900, detached home prices are only one per cent lower than last year, with most of the adjustments driven by the North East and North districts.

Detached

Sales in September slowed to 859 units, nine per cent lower than last year and below long-term trends for September. At the same time, new listings rose to 1,905 units, causing the sales to new listings ratio to fall to 45 per cent, levels not seen since 2018. While there has been an unexpected shift in September, it is too early to tell if this trend will continue as prior to this month the detached market has remained relatively balanced.  

Improved supply choice is causing prices to decline relative to the record highs reported during the spring. As of September, the unadjusted benchmark price was $749,900, down nearly one per cent from both last month and last year. While prices have eased from peak levels across all districts, the largest decline occurred in the North East and East district at over six per cent. Despite recent adjustments on a year-to date basis, prices remain nearly two per cent higher than last year’s levels, with the City Centre reporting the highest gain at over four per cent. 


Semi-Detached

New listings rose to 361 units in September, while sales fell to 156 units, causing the sales to new listings ratio to drop to 43 per cent. This also caused a rise in inventory levels and the months of supply pushed up to nearly four months. This is a significant shift compared to last month, where there was less than three months of supply. 

Like the detached sector, it is too early to say if this trend will continue, but so far it has had minimal impact on home prices. As of September, semi-detached price was $684,800, slightly lower than last month and nearly one per cent higher than last year. Year-to-date price growth has been the highest for semi-detached homes at over three per cent, as this segment took longer to shift from a seller's market to one that was more balanced. Most of the price growth was driven by gains reported in the City Centre. 


Row

Following a pullback last month, new listings posted modest monthly gains. The 592 new listings were met with 304 sales, causing the sales to new listings ratio to fall to 51 per cent. This is not as low as the other property types and at these levels it was enough to prevent any further monthly gain in the already elevated inventory levels. September inventory levels were 1,099 units, the highest September level reported since 2018, and 30 per cent higher than longer-term trends for the month. The largest gains in inventory occurred in the North East district, which also reported the highest months of supply and price decline compared to last year. 

More supply choice has impacted resale prices, with the unadjusted benchmark price being $437,100. This is down less than one per cent over last month and nearly five per cent lower than last year’s prices. Year-to-date price adjustments have been much smaller at one per cent, as declines in the North East, North and South East districts offset the gains reported in other parts of the city. 


Apartment Condominium

The most significant adjustment in the market occurred in the apartment condominium sector as improving rental supply, delayed adjustments in interest rates and improved selection for other property types has slowed apartment style demand from both first-time buyers and investors. September reported 401 sales and 924 new listings, dropping the sales to new listings ratio to 43 per cent and causing inventory to rise to 1,999 units. 

The rise in supply caused the months of supply to push up to five months, the first time it has done that since 2021. As elevated levels of supply have persisted since June, prices have been trending down. As of September, the benchmark price was $322,900, down over one per cent compared to last month and over six per cent compared to last year. The year-to-date price adjustment has been just over one per cent. Condo prices have slid across all districts compared to last September. The largest decline occurred in the North East district at over ten per cent, while the smallest decline occurred in the City Centre at five per cent. 


REGIONAL MARKET FACTS


Airdrie

New listings reached a September record high with 295 units. The gains in new listings were met with a pullback in sales causing the sales to new listings ratio to fall to 45 per cent and inventory rose to 571 units. While inventories have been generally trending up throughout this year, this is the first time that the months of supply pushed above four months since 2020. The improved options weighed on home prices, which continued to trend down this month. In September, the unadjusted benchmark price was $526,000, down one per cent compared to last month and nearly five per cent lower than last year's levels. Despite recent adjustments year-to-date prices declined by just over one per cent, not enough to offset last year's annual growth of eight per cent. 
 

Cochrane

New listings in Cochrane also hit a September record high with 148 units. While sales are similar to last year's levels at 62 units, the boost in new listings did cause the sales to new listings ratio to drop to 42 per cent this month. This led to further inventory gains and the months of supply pushed above five months. Improved supply levels also took more pressure off home prices this month. In September, the unadjusted benchmark price was $584,300, down by nearly one per cent compared to last month, but still one per cent higher than last year's levels. Much of the supply adjustment has only recently occurred in the Cochrane market and the year-to-date benchmark price remains nearly four per cent higher than last year. 
 

Okotoks

Okotoks was one of the few larger areas that did not see a lift in new listings in September. The 69 new listings were down compared to levels reported last year, and with 51 sales this month, the sales to new listings ratio remained elevated at 74 per cent. While inventory levels were only slightly higher than last month, the months of supply has remained relatively low at two and a half months. Despite the relatively tight conditions, prices continued to adjust in the market. This in part can be related to the competition from new properties, impacting resale prices. As of September, the total residential benchmark price was $613,900, down by over one per cent compared to last month and nearly three per cent lower than last September. Despite the adjustment, on a year-to-date basis, prices were still one and a half per cent higher than last year. 

Read

AUGUST 2025 HOUSING MARKET UPDATE

Price declines mostly driven by higher density home types

Improving supply choice has changed the dynamics of the Calgary market driving price declines over the past several months. Higher price adjustments are occurring for apartment and row style properties while detached and semi-detached properties have reported modest declines. As of August, the unadjusted total residential benchmark price was $577,200, down over last month and nearly four per cent lower than levels reported last year.

“Perspective is needed when it comes to price adjustments. The most significant price adjustments are occurring for row and apartment style homes as they are also the product type that are facing the largest gains in supply choice,” said Ann-Marie Lurie, Chief Economist at CREB®. “Meanwhile price adjustments in the detached and semi-detached markets range from modest price growth in some areas to larger price declines in areas with large supply growth. Overall, recent price adjustments have not offset all the gains that have occurred over the past several years.”

August reported 1,989 sales, nearly nine per cent lower than last year. Sales have slowed compared to the high levels reported over the past four years. However, activity is still above long-term trends, reflecting relatively strong demand. What has changed is the supply situation. New listings remain elevated, keeping the sales-to-new-listings ratio below 60 per cent and pushing inventory to 6,661, the highest August amount since 2019. 

More inventory choice coupled with lower sales has caused the months of supply to rise to 3.4 months in August, much higher than the sellers' market conditions reported over the previous four years, but still well below the buyer market conditions observed prior to the pandemic. While the market is much more balanced compared to last year, there is significant variation depending on property type, price range and location.   

Detached

Detached home sales eased to 995 units in August, while new listings rose to 1,748 units, keeping the sales-to-new listings ratio below 60 per cent. This prevented any significant shift in inventory, as the 3,051 units were the highest levels reported in August since 2020. Higher inventory levels and easing supply have helped balance out the detached market. However, districts like the North East, North and East are experiencing buyer market conditions.   
  
The unadjusted benchmark price in August was $755,600 down by nearly one per cent over last month and last year's levels. While prices have eased there is significant variation depending on location. Compared to last year, prices reported the largest decline in the North East and East district at five per cent, while prices in the city centre were over two per cent higher. As many of the adjustments have occurred over the past few months, year-to-date Calgary prices remain two per cent higher than last year.
 

Semi-Detached

August sales improved over last year’s levels, but it was not enough to offset earlier pullbacks with year-to-date sales of 1,557—eight per cent lower than last year—but higher than long-term trends. At the same time, new listings slowed compared to sales pushing the sales-to-new listings ratio up to 67 per cent and preventing any further monthly inventory gains. Inventory gains have not been as high for this product type, and the months of supply remained below three months in August. This is one of the reasons that the prices have not seen the same adjustment.
 
In August the unadjusted benchmark price was $687,200 down over last month, but nearly one per cent higher than last year, and nearly four per cent higher on a year-to-date basis. Price growth has varied across the city, with the largest year-over-year gains occurring in city centre. Meanwhile the largest declines have occurred in the North East, East and North districts.
 

Row

Sales in August slowed, contributing to the year-to-date decline of nearly 16 per cent. While new listings did ease in August compared to last year and last month, they have generally been on the rise pushing up inventory levels. In August, there were 1,103 units in inventory, reaching the second highest level on record for August, only slightly lower than the record high in reported in 2018. Due to the relatively strong sales, the months of supply has only pushed slightly above three months, far more balanced than last year, but not as high as the 6.4 months report back in 2018.
 
Nonetheless, additional supply choice has weighed on prices. In August, the unadjusted benchmark price in the city was $439,600, reflecting the fourth consecutive monthly decline and nearly five per cent lower than last August. While prices eased across all districts, price declines exceeded five per cent in the North East, North, South and East districts. These districts generally reported high levels of supply in the resale sector or had significant competition from new home supply.


Apartment Condominium

Sales continue to slow in August contributing to a year-to-date pullback of nearly 30 per cent. While sales are still above long-term trends, they have not been high enough to offset the level of new listings in the market. In August alone there were 877 new listings compared to the 449 sales, keeping the sales-to-new-listings ratio relatively low at 51 per cent. The low ratio that has persisted throughout this year has contributed to the higher inventory levels seen in the market. While August inventory levels did not rise over last month, with 1,979 units available, this is the highest August inventory ever reported.
 
The months of supply for apartment condos have remained around four months since June. The excess supply relative to demand has been weighing on prices. As of August, the unadjusted benchmark price was $326,500, reflecting the fifth consecutive monthly decline and nearly six per cent lower than levels reported last August. Most of the supply is concentrated in the City Centre, which reported a year-over-year decline of five per cent, slightly higher than the rate of decline reported in the West district at three per cent. Meanwhile, the highest price declines occurred in the North East district at over 11 per cent.


REGIONAL MARKET FACTS


Airdrie

Easing sales in August contributed the year-to-date decline of 12 per cent for 1,248 sales so far this year. The 152 sales this month was met with 265 new listings, pushing the sales-to-new listings ratio up to 57 per cent and preventing any further monthly inventory gains. As of August, there was 535 units in inventory, above long-term trends and the highest levels reported since before the pandemic. The rise in supply has helped shift the market to more balanced conditions. However, with more supply options in both the new home, resale markets and in competing locations, there has been some downward pressure on prices in Airdrie. In August, the unadjusted total residential benchmark price was $531,100, down over last month and four per cent lower than levels reported last August.


Cochrane

The 70 sales this month were met with 139 new listings causing the sales-to-new listings ratio to fall to 50 per cent, the lowest ratio reported for August since 2015. The pullback in sales compared to new listings prevented any significant shift in inventory levels, pushed the months of supply up above four months. Despite the shift this month, prices in Cochrane remained relatively stable in August, with the unadjusted benchmark price sitting at $589,100, similar to last month and nearly two per cent higher than last year. On a year-to-date basis prices are four per cent higher than the previous year.


Okotoks

New listings in August reported a significant pullback relative to sales and the sales-to-new-listings ratio pushed up to 80 per cent. While sales have generally remained in line with long-term trends, new listings have not had the same increase that other areas have reported, preventing significant gains in inventory levels. As of August, there was 116 units in inventory, a 29 per cent gain over last year, but still 30 per cent lower than levels traditionally seen in August. Despite tighter conditions, prices have reported some monthly declines. However, year-to-date benchmark prices remained two per cent higher than last year’s levels, with gains reported across each property type.

Contact us for FREE HOME EVALUATION.

Read

JULY 2025 -Supply growth weighs on home prices

Thanks to gains mostly occurring in the newer communities, inventory levels in July were 6,917 units, reaching levels not seen since prior to the pandemic and higher than long-term trends. While supply has improved across all property types and all districts, the largest gains are occurring in the areas where there has been new community growth. 
 
The additional supply has weighed on home prices in some parts of the city. The total residential benchmark price in Calgary has trended down over the past several months and is currently four per cent below last year’s peak price reported in June 2024. 
 
“Price declines are not occurring across all property types in all locations of the city, and even where there have been declines, it has not erased all the gains made over the past several years,” said Ann-Marie Lurie, Chief Economist at CREB®. “The steepest price declines have occurred for apartment and row style homes, mostly in the North East and North districts, which coincides with significant gains in new supply.” 
 
The rise in supply occurred as sales continued to slow and new listings improved. In July, there were 2,099 sales, a 12 per cent decline over last year, while new listings reached 3,911 units, an over eight per cent increase over last year. In addition to the persistent economic uncertainty due to tariffs, sales and new listings were impacted by no further reductions in lending rates and added competition from the new home market. Apartment-style homes are reporting the highest months of supply with over four months, while both detached and semi-detached homes are seeing conditions remain relatively balanced at just three months of supply.  

Detached

For the first time since 2020, the months of supply for detached homes rose to three months. Sales activity slowed to 1,031 units in July, while the number of new listings, despite being slower than last month, was still nearly 10 per cent higher than last year’s levels and above long-term trends. The wider gap between sales and new listings led to a significant adjustment in inventory levels and, with slower sales, the months of supply rose to three months.

However, conditions did vary significantly depending on location. In the North West, West and South districts, the months of supply remained well below three months, whereas the North East reported the highest months of supply at over four months. 
 
A shift to balanced conditions has taken much of the pressure off home prices. As of July, the detached benchmark price was $761,800, down less than one per cent over last year. However, there was a significant range of price adjustments. Both the North East and East districts have reported the largest decline in price at five per cent, though prices still rose in the City Centre by nearly two per cent. 

Semi-Detached

Sales activity in July continued to slow, contributing to the year-to-date decline of 11 per cent. At the same time, new listings have generally been higher this year compared to last year, supporting inventory gains. With 549 units in inventory and 187 sales, the months of supply in July rose to three months, something that has not happened since 2021. 
 
Although supply is improving in relation to sales, prices have remained relatively stable. As of July, the benchmark price in the city was $697,500, one per cent higher than last July. Price growth did range throughout each district, with the highest gains occurring in the City Centre, with nearly three per cent growth. Meanwhile, prices declined over last year in the North East, East and North districts.

Row

Like other styles of homes, sales have eased compared to last year, with new listings and inventories rising over last July. The months of supply in July was similar to last month at over three months, with a range of under three months of supply in the City Centre, North West , South and South East, to nearly five months of supply in the North East district.
 
Row prices have generally been trending down over the past three months, and while they are nearly four per cent lower than last year at this time, on a year-to-date basis they have remained similar to last year. When considering activity by district, year-to-date price declines have been reported in the North East and North, while prices have risen in all other districts.
 

Apartment Condominium

There were 1,014 new listings in July relative to 508 sales, keeping the sales-to-new listings ratio at 50 per cent and inventory levels elevated at 2,097 units. Higher inventories and slower sales caused the months of supply to push above four months in July, the highest it has been since 2021. Added competition for new product combined with rising rental vacancy rates has impacted the resale condominium market.
 
The additional supply choice is having a more significant impact on apartment style prices over any other property type. In July, the benchmark price was $329,600, which is down over one per cent compared to last month and nearly five per cent lower than levels reported last year. However, when considering year-to-date figures, prices have remained stable compared to last year as gains in the West, South and North West have offset declines occurring in the North East, North, South East and East districts.


REGIONAL MARKET FACTS


Airdrie

Due to declines in both row and apartment sales, July sales slowed by 14 per cent compared to last July, contributing to the year-to-date decline of 12 per cent. While sales have slowed, activity remains higher than levels reported prior to 2021. What has changed is the significant improvement in new listings, resulting in inventory gains. As of July, inventory levels rose to 543 units, the highest July reported since the peak in 2018. The higher inventory levels kept the months of supply above three months in July, placing some downward pressure on home prices. In July, the benchmark price was $532,800, nearly four per cent lower than levels reported last year at this time. However, last year’s gains were exceptionally high earlier in the year, and on a year-to-date basis prices are only slightly lower than last year.

Cochrane

Unlike other areas, Cochrane has not seen the same level of pullback in sales compared to long-term trends. While July sales were down by seven per cent, year-to-date sales are two per cent lower than last year and 23 per cent higher than long-term trends. New listings in July did reach a record high for the month, causing inventories to push to the highest level reported for the month since 2019 and causing the months of supply to rise above three months. While this likely contributed to some of the monthly decline in price, unlike other areas the July benchmark price of $590,000 was over two per cent higher than last year, and four per cent higher on a year-to-date basis.

Okotoks

This market continues to exhibit tighter market conditions than both Airdrie and Cochrane with a sales-to-new-listings ratio of 71 per cent and months of supply at just over two months. This is a significant improvement compared to the previous four years, where the months of supply in July was just over one month. In July, the benchmark price in the area was $628,500, slightly lower than last month, but higher than last year’s level. Despite some monthly fluctuations, year-to-date prices are over two per cent higher than last year.

Contact us for FREE HOME EVALUATION.

Read

Gains in resale supply mostly impact apartment and row style home prices

Inventory levels in June continued to rise, both over last month’s and last year’s levels. By the end of the month, inventory reached 6,941 units, returning to levels reported in 2021, or prior to the surge in population growth. While sales have remained consistent with long-term trends despite a decline from recent months, higher levels of new listings compared to sales have contributed to the inventory gain.

All property types have reported gains in inventory, but both row and apartment style homes reported inventory levels over 30 per cent higher than long-term trends, while supply for detached and semi-detached units are only slightly higher than typical levels.

“Supply has improved across rental, resale and new home markets, allowing for more choice for those considering their housing options,” said Ann-Marie Lurie, Chief Economist at CREB®. “The additional choice combined with no further declines in lending rates, persistent uncertainty and concerns of price adjustments is keeping many potential purchasers on the sidelines. This is weighing on home prices, especially for apartment and row style homes.”

The unadjusted benchmark price was $586,200 in June, lower than last month and over three per cent lower than last year. Much of the citywide decline was driven by apartment and row style homes, which are over three per cent lower than last year. Meanwhile, detached prices have remained relatively stable and semi-detached homes are still slightly higher than last year.

The steeper price declines for apartment and row style homes are reflective of those segments shifting toward a market that favours the buyer with nearly four months of supply. Meanwhile conditions are relatively balanced for detached and semi-detached homes. Overall conditions in Calgary have changed, but not enough to erase the significant growth in prices that have occurred over the past four years.
 

Detached

Sales in June were 1,194 units, six per cent lower than both last year and last month's activity. Sales activity did vary depending on location and price range, with declines in resale sales mostly for higher priced homes that likely face more competition from new homes. On a location basis, the steepest declines in sales occurred in the City Centre and the North East at over 20 per cent, while year-over-year gains were reported in the West, and South East districts. 
 
While sales did vary, inventories and new listings improved across most price ranges and districts in the city. However, it is only the North East district that is experiencing conditions that favour the buyer, causing prices to decline by four per cent compared to last June. As of June, the unadjusted benchmark price in Calgary was $764,300, less than one per cent lower than both last month and last year’s price.

Semi-Detached

Sales activity continued to slow this month, contributing to the year-to-date decline of nearly 12 per cent. At the same time new listings have generally been rising compared to last year, supporting inventory gains and a shift to balanced conditions. As of June, the months of supply was 2.6 months, a significant improvement over the tight conditions reported last year.
 
Additional supply choice has slowed the pace of price growth for semi-detached homes. As of June, the benchmark price in the city was $696,400, similar to last month, and over one per cent higher than last June. Price movements did range by district, as homes in the City Centre are over three per cent higher than last year and at record high levels, while prices in the North, North East, and East districts are all over two per cent lower than last year and three per cent lower than last year’s peak price.

Row

New listings continue to rise relative to the number of sales in the market, as the sales-to-new listings ratio in June dropped to 50 percent. This contributed to further inventory gains with 1,167 units available at the end of the month. While sales are still higher than long-term trends, the recent gains in inventory levels have caused the months of supply to push above three months. Within the city, conditions range with nearly six months of supply in the North East and two and a half months of supply in the North West.
 
Higher supply levels relative to demand are weighing on prices which, at a June benchmark price of $450,300, are down over last month and three per cent lower than last year’s levels. However, as the level of oversupply does range across the districts, so too do the price movements. The City Centre has seen the most stability in prices this month and is only one per cent below last year’s peak. Meanwhile, the North East is reporting year-over-year price declines of nearly six per cent.
 

Apartment Condominium

June new listings and sales both eased over last month’s and last year’s levels. However, with 1,024 new listings and 532 sales, inventories continued to rise and the months of supply pushed up to nearly four months. Slower international migration numbers are weighing on housing demand just as supply levels are rising, which is having a larger impact on apartment style homes.
 
The rising supply choice, both in new and resale markets, has caused resale prices to trend down again this month, leaving June’s benchmark price of $333,500 over three per cent lower than last year’s levels. While prices have eased across all districts in the city, the largest year-over-year declines are occurring in the North East, North and South East districts.


REGIONAL MARKET FACTS


Airdrie

Thanks to a sharp decline in detached activity, sales in June fell to 164 units. The pullback in sales was met with 324 new listings, causing the sales-to-new listings ratio to drop to 51 per cent, the lowest ratio reported in June since 2018. The wider spread between sales and new listings drove further inventory gains and for the first time since 2020 the months of supply was above three months. The additional supply choice has weighed on resale prices, which have trended down for the second consecutive month. In June the benchmark price was $538,300, nearly three per cent lower than levels seen last year at this time.

Cochrane

Gains for detached and semi-detached sales were offset by pullbacks for row and apartment units, as June sales remained relatively unchanged over last year. The 101 sales in June were met with 171 new listings and the sales-to-new listings ratio rose to 59 per cent. This slowed the pace of inventory growth, keeping the months of supply just below three months. While conditions are more balanced than they have been, prices in the area continue to rise albeit at a slower pace. As of June, the unadjusted benchmark price was $593,700, nearly one per cent higher than last month and four per cent higher than last June.

Okotoks

While levels are better than last year, both sales and new listings trended down in June, causing the sales-to-new listings ratio to rise to 87 per cent. This prevented any further monthly inventory gains and ensured that the months of supply remained below two months in June. While conditions remain tight in Okotoks, more supply in the broader region has likely prevented stronger price growth in the Town of Okotoks. As of June, the unadjusted benchmark price was $632,800, similar to last month and nearly three per cent higher than last year.

Contact us for a Free Home Evaluation.

Read
Data is supplied by Pillar 9™ MLS® System. Pillar 9™ is the owner of the copyright in its MLS®System. Data is deemed reliable but is not guaranteed accurate by Pillar 9™.
The trademarks MLS®, Multiple Listing Service® and the associated logos are owned by The Canadian Real Estate Association (CREA) and identify the quality of services provided by real estate professionals who are members of CREA. Used under license.