RSS

Calgary Real Estate Summary – Springbank Hill October 2024

Springbank Hill Real Estate Summary

Market Overview

  • Sales: 17 transactions, a 70% year-over-year (Y/Y) increase.

  • New Listings: 29 properties, a 38% Y/Y increase.

  • Inventory: 47 active listings, reflecting a 47% increase compared to October 2023.

  • Months of Supply: 2.76 months, indicating a balanced market.

Pricing

  • Benchmark Price: $920,800, up 2.9% Y/Y.

  • Median Price: $940,000, a 4.2% increase Y/Y.

  • Average Price: $1,002,046, up by 12.8% compared to October 2023.

Property Types

  • Detached Homes: Benchmark price at $1,121,500, a 7.9% Y/Y increase.

  • Semi-Detached Homes: No benchmark price specified; however, significant demand was noted.

  • Row Houses: Benchmark price of $530,400, reflecting a 13.6% Y/Y increase.

  • Apartments: Benchmark price at $392,500, a 17.2% Y/Y rise.

Market Trends

  • Steady growth in home values, particularly in the apartment and row house segments.

  • Increasing new listings and inventory highlight a more competitive market.

  • Sales to new listings ratio indicates a moderate absorption rate of 0.59.

Summary

Springbank Hill’s October 2024 market remains robust, with a significant increase in sales and rising property values across most property types. The market is balanced with growing inventory, suggesting opportunities for buyers and sellers alike.

This performance underscores the continued demand and resilience in this desirable community.

Read

Arbour Lake Real Estate Monthly Summary – October 2024

In October 2024, the real estate market in Arbour Lake, Calgary, reflected a dynamic yet balanced environment. Here’s a detailed overview of the market trends and community highlights for the month.

Market Highlights

  • Sales Activity: A total of 9 residential properties were sold in October, reflecting a 31% year-over-year decline.

  • New Listings: There were 18 new listings, marking a 13% increase from the same period last year, indicating a growing interest in selling within the community.

  • Inventory: The inventory stood at 29 properties, a significant 164% increase year-over-year, translating to 3.22 months of supply—a sign of more options for potential buyers.

  • Benchmark Prices:

    • Overall residential benchmark price reached $596,500, a 2.6% increase from the previous year.

    • Detached homes led with a benchmark price of $744,700, followed by semi-detached at $600,600 and apartment units at $341,900.

  • Market Trends: The sales-to-new-listings ratio stood at 0.5, indicating a more balanced market leaning slightly toward a buyer’s market.

Community Features

Arbour Lake remains one of Calgary’s most sought-after neighborhoods, offering both urban convenience and natural beauty:

  • Lake Access: Residents enjoy exclusive access to Calgary’s only northwest lake, ideal for swimming, boating, and year-round fishing.

  • Recreational Amenities: The community is known for its walking trails, parks, and proximity to fitness facilities, making it perfect for an active lifestyle.

  • Schools and Family Appeal: Highly rated schools and family-oriented amenities contribute to its desirability.

  • Connectivity: With access to major roadways and public transit, commuting to downtown Calgary or other areas is seamless.

  • Shopping and Dining: Local shopping centers and a variety of restaurants cater to daily needs and lifestyle preferences.

Arbour Lake continues to offer a combination of strong property values and high quality of life, making it an appealing choice for homeowners and investors alike.

If you’d like a deeper dive into specific property types or trends, let me know!

Read

Calgary Real Estate Market Report – New Brighton October 2024

Overview: The real estate market in New Brighton, SE Calgary, saw notable shifts in October 2024, characterized by increased listings, rising inventory, and a modest uptick in prices. Known for its community-oriented amenities and family-friendly atmosphere, New Brighton continues to attract buyers, though inventory growth suggests a slightly more balanced market.

Market Activity and Sales Trends:

  • Sales Volume: There were 20 sales in October, representing a 33% increase compared to the previous year. This indicates solid demand, especially for properties priced competitively in this suburban neighborhood.

  • New Listings: A total of 28 new listings were introduced, marking a 40% increase year-over-year. This increase in supply provides buyers with more choices and has slightly tempered the competition.

  • Months of Supply: The months of supply rose to 1.80, an increase of 112% year-over-year, reflecting the higher inventory level and a move towards a more balanced market.

  • Average days on the market: 19 days.

Price Trends:

  • Detached Homes: 11 SOLD, $570,000 - $825,000. The benchmark price for detached homes rose to $669,800, a year-over-year increase of 6.5%. Detached properties remain popular due to their space and family-friendly features. Average days on the market: 16 days.

  • Semi-Detached and Row Homes: 2 SOLD, $550,000 - $572,000. The benchmark for semi-detached homes reached $580,500, while row homes averaged $454,900, both showing an approximate 7% increase. This suggests ongoing demand for moderately priced housing. Average days on the market: 21 days.

  • Townhouses: 7 SOLD, $398,000 - $475,000. The benchmark price for apartments reached $363,000, marking a 7.7% increase year-over-year. This segment offers a more affordable entry point into the market. Average days on the market: 23 days.

Buyer and Seller Dynamics:

  • For Buyers: With increased inventory and stable prices, buyers have more flexibility in choosing a property, especially among row homes and semi-detached options.

  • For Sellers: Sellers should anticipate more discerning buyers due to increased listings. Properties in excellent condition and competitively priced, particularly detached homes, continue to perform well.

Conclusion: The New Brighton market in October 2024 showed increased inventory and steady price growth across housing types. This balanced environment provides opportunities for both buyers and sellers, making it a stable market in Calgary’s southeast quadrant​,

Read

Calgary Real Estate Market Overview – Harvest Hills October 2024

Market Trends

  • Sales Activity:

    • A total of 13 homes were sold in October 2024, marking an 86% increase from the previous year, indicating a strong demand for properties in the area.

  • New Listings:

    • 11 new listings were added, reflecting an 8% decline year-over-year, contributing to the ongoing shortage of inventory.

  • Inventory:

    • 20 active listings, showing an 82% increase compared to last year, suggesting a growing supply of homes.

  • Benchmark Prices:

    • The overall residential benchmark price reached $548,900, reflecting a 3.4% annual increase.

  • Months of Supply:

    • The current months of supply is 1.54, reinforcing a seller’s market, meaning demand is still outpacing supply.


Market Breakdown by Property Type

Detached Homes

  • Sales: 4 homes sold, marking a 43% decline year-over-year.

  • New Listings: 5 new detached home listings (-44% Y/Y).

  • Benchmark Price: $630,200, showing a 12% increase compared to last year.

  • Market Trend: Despite fewer sales, detached homes remain in demand with steady price growth.

Semi-Detached Homes

  • Sales: No sales were recorded in this category for October 2024.

  • New Listings: No new listings.

  • Benchmark Price: N/A.

  • Market Trend: Limited activity in this segment, suggesting a low supply or lack of demand.

Row (Townhouses)

  • Sales: 5 units sold, no change from the previous year.

  • New Listings: 1 new listing (unchanged Y/Y).

  • Benchmark Price: $433,200, reflecting a 6.5% increase from last year.

  • Market Trend: Townhouses remain a popular and stable housing option, with prices gradually increasing.

Apartments

  • Sales: 4 apartment sales, a 267% increase from last year.

  • New Listings: 5 new listings, a 150% increase Y/Y.

  • Benchmark Price: $426,200, increasing 4.7% annually.

  • Market Trend: A surge in apartment demand, possibly due to affordability concerns in the detached home market.


Community Features

1. Schools & Education

Harvest Hills is well-served by a variety of public and Catholic schools, offering both elementary and high school options. Some of the closest schools include:

  • Ascension of Our Lord School (K-9, Catholic)

  • Harvest Hills Montessori

  • Northern Lights School (Public K-4)

2. Transportation & Accessibility

  • Roads: Convenient access to Deerfoot Trail and Country Hills Boulevard, allowing quick connectivity to downtown and Calgary International Airport.

  • Public Transit: Several bus routes service the area, connecting to major transit hubs.

3. Shopping & Retail

  • Country Hills Town Centre: Features major retailers, grocery stores, and restaurants.

  • Creekside Shopping Centre: Offers additional shopping, dining, and essential services nearby.

4. Recreation & Green Spaces

  • Harvest Hills Park: A popular outdoor space for walking, jogging, and family activities.

  • Nose Creek Parkway: A nearby natural park area offering trails and scenic views.

  • Golf Courses: Close to Country Hills Golf Club, providing an excellent option for golf enthusiasts.


Harvest Hills continues to see strong demand, particularly in the apartment and townhouse segments due to affordability. Detached homes remain desirable, but higher prices have slightly slowed sales. The community's proximity to amenities, schools, and major roadways makes it a highly attractive area for buyers.

Read

Calgary Real Estate Market Report – Mahogany October 2024

Market Overview

In October 2024, the Mahogany SE Calgary real estate market experienced notable activity, with increases in sales across property types. Total residential sales for the month reached 46 houses, representing a 53% year-over-year increase. New listings were also up, reaching 54, an 8% increase year-over-year. Inventory saw a more significant rise, growing by 61% to 98 units. The sales-to-new-listings (S/NL) ratio stood at 85%, indicating a competitive market despite the growing inventory levels. The months of supply metric rose to 2.13, reflecting a balanced market yet trending toward a potential buyer's market if inventory growth continues.

The benchmark price for all residential properties in Mahogany rose by 4% year-over-year to $590,900.

Detached Homes

  • Sales: 22 (up 57% year-over-year)

  • New Listings: 29 (up 7% year-over-year)

  • Inventory: 37 (up 9% year-over-year)

  • Months of Supply: 1.68 (down 31% year-over-year)

  • Benchmark Price: $809,100 (up 5% year-over-year)

Detached homes remained popular, with a 57% increase in sales and a tight supply of only 1.68 months, marking a slight seller's advantage in this category. The benchmark price rose 5% to $809,100, indicating steady demand for single-family homes in Mahogany.

Semi-Detached Homes

  • Sales: 8 (up 300% year-over-year)

  • New Listings: 7 (up 40% year-over-year)

  • Inventory: 8 (no change year-over-year)

  • Months of Supply: 1.00 (down 75% year-over-year)

  • Benchmark Price: $568,200 (up 7% year-over-year)

Semi-detached homes saw the highest increase in sales at 300%, with a balanced supply level of 1.00 month. This segment is seeing strong buyer interest, as evidenced by the quick sales pace and a 7% increase in the benchmark price to $568,200.

Row Homes

  • Sales: 4 (up 33% year-over-year)

  • New Listings: 2 (down 50% year-over-year)

  • Inventory: 20 (up 567% year-over-year)

  • Months of Supply: 5.00 (up 400% year-over-year)

  • Benchmark Price: $490,400 (up 7% year-over-year)

Row homes showed a mixed performance. Sales increased by 33%, but new listings dropped by 50%, leading to a spike in inventory, which now sits at 20 units, a 567% year-over-year increase. With a months of supply at 5.00, row homes are transitioning into a buyer’s market, despite a 7% increase in the benchmark price.

Apartments

  • Sales: 12 (up 9% year-over-year)

  • New Listings: 16 (up 14% year-over-year)

  • Inventory: 33 (up 106% year-over-year)

  • Months of Supply: 2.75 (up 89% year-over-year)

  • Benchmark Price: $369,700 (up 13% year-over-year)

The apartment market has become more competitive, with inventory rising 106% to 33 units and the months of supply increasing to 2.75. Sales were up 9%, and the benchmark price rose 13% to $369,700, indicating resilient demand despite the increased supply.

Price Range Distribution

The distribution of sales by price range showed a concentration in the $400,000–$499,999 range, followed by a significant number of transactions in the $200,000–$300,000 and $300,000–$400,000 ranges. Higher price brackets, particularly above $700,000, also saw activity but to a lesser extent.

Year-to-Date Overview

As of October 2024, year-to-date sales totaled 373, reflecting a slight 1% decrease from the previous year. New listings year-to-date reached 550 (up 12%), while inventory rose to 76 units (up 29%). The year-to-date benchmark price increased by 7% to $595,180, underscoring steady appreciation in Mahogany’s residential market despite slight reductions in sales volume​.

Conclusion

Overall, Mahogany’s real estate market in October 2024 demonstrates robust demand and rising prices across most property types, with particular strength in detached and semi-detached homes. While inventory levels are increasing, especially in row homes and apartments, the area’s popularity supports ongoing price growth.

Read

Calgary Real Estate Market Report -McKenzie Lake October 2024

Sales Overview
McKenzie Lake experienced a notable increase in sales activity in October 2024, with total residential sales rising by 44% year-over-year (Y/Y) to reach 13 sales. THEY ARE ALL DETACHED HOMES, $470,000-$960,000, with an average 26 Days on the market. 5 properties were SOLD at or above the asking price. This growth reflects increased demand in the area, particularly for detached homes, which saw an 86% increase in sales compared to October 2023.

New Listings and Inventory
New listings for October 2024 totaled 21 properties, marking a significant 75% Y/Y increase, suggesting that more homeowners are entering the market. However, inventory remains relatively constrained, with only 20 active listings.

Price Trends

  • Detached Homes: The benchmark price for detached properties in McKenzie Lake rose to $749,800, reflecting an 8.4% increase compared to last year.

  • Row and Apartment Prices: The row homes in McKenzie Lake averaged $423,900, a modest 8.1% Y/Y increase. Apartments showed no recorded transactions, which aligns with ongoing demand predominantly centered on detached properties.

Market Conditions
The market conditions remain tight in McKenzie Lake, with months of supply at 1.54, indicating a seller’s market. This low supply relative to demand continues to put upward pressure on home prices.

Conclusion
The McKenzie Lake real estate market remains robust with strong demand, rising prices, and limited inventory. While new listings are up, months of supply remains low, signaling continued demand and competition among buyers, especially for detached homes.

Read

Calgary Real Estate Market Report - McKenzie Towne October 2024

Market Overview McKenzie Towne’s real estate market continued to show moderate growth with sustained demand across different housing types, but it also experienced some variation in inventory and prices year-over-year.

Sales and Inventory

  • Total Residential Sales: 33 properties, reflecting a year-over-year increase of 3%.

  • New Listings: 35 properties, indicating no significant change from October 2023.

  • Inventory: Increased by 56% year-over-year to 39 units, a sign of growing supply in response to steady demand.

  • Months of Supply: Increased to 1.18 months, a 56% increase, showing a slight cooling from a highly competitive market.

  • Average Days on the Market: 24 days

Property Types and Price Trends

  1. Detached Homes:

    • Sales: 16 properties, up by 45% from last year.

    • Inventory: 13 properties, slightly down by 7%.

    • Benchmark Price: $650,200, a 3.1% year-over-year increase.

    • Price range: $500,000 - $950,000.

    • Average Days on the Market: 23 days

  2. Semi-Detached Homes:

    • Sales: 2 properties, unchanged from last year.

    • Inventory: 5 properties, marking a 25% increase.

    • Benchmark Price: $482,500, reflecting a robust 9.7% price increase year-over-year.

    • Price range: $450,000 - $505,000.

    • Average Days on the Market: 9 days

  3. Row Homes:

    • Sales: 5 units, down by 29% compared to October 2023.

    • Inventory: 8 units, a significant 167% increase.

    • Benchmark Price: $432,900, up by 9.3% from last year.

    • Price range: $319,500 - $435,000.

    • Average Days on the Market: 24 days

  4. Apartments:

    • Sales: 10 units, decreasing by 17%.

    • Inventory: 9 units, down by 36%.

    • Benchmark Price: $343,000, up by 9.6% year-over-year.

    • Price range: $230,000 - $450,000.

    • Average Days on the Market: 28 days

Price Trends

  • Total Residential Benchmark Price: $503,200, representing a 6.4% increase year-over-year, indicating overall appreciation in property values across McKenzie Towne.

Conclusion McKenzie Towne’s real estate market remains active and largely balanced. The slight increase in inventory and months of supply suggests a shift toward a more balanced market, with home prices continuing to appreciate across property types. Buyers can expect a moderate pace in the market, with slightly less pressure compared to previous months.

Read

How long does it take to receive a condo plan?

By CREB®

The time required to obtain condo documents from a condo management company can vary, but legally, a condominium corporation—often represented by a condo management company—must respond to a written request for condo documents within 10 days of receiving it.

As a REALTOR®, it’s essential to be proactive and request these documents as early as possible to avoid delays. 

Condo management companies generally operate only during business hours, so it’s crucial to know the company’s contact details and hours of operation when making your request. 

Best practices for requesting condo documents 

When representing a seller, request condo documents immediately. These documents are vital for listing a condo unit on the MLS® System, as they include essential information like: 

  • Condo fees

  • Legal description 

  • Parking stall number 

  • Storage locker number 

  • Special assessments 

  • Pet policies 

Having accurate and up-to-date condo documents ensures your MLS® listing is correct. Although sellers may already have some documents on file, verifying the information with the condo management company is still recommended to account for any recent changes, such as bylaw amendments or changes. 

Fees for condo documents 

Condo corporations are required to provide some documents at no cost, while others may have a fee associated with them. For example: 

  • Documents like the annual budget, financial statements, and reserve fund reports must be provided free of charge when first distributed to owners. However, replacement copies may incur a fee of up to $10.

  • For rush requests (documents needed within three days), corporations can charge up to $20 per document.

  • The Estoppel Certificate and Information Statement are generally the most expensive, with fees reaching up to $200 for the Estoppel and $100 for the Information Statement. 

For a full list of allowable fees, please refer to the Alberta Government’s resource: Condominium documents: for owners, mortgagees, and prospective purchasers - Open Government. 

Read

Spread the warmth this winter - By CREB®

Coats for Calgary is hosting their 14th annual jacket drive in support of the Calgary Drop-In Centre—and CREB® is helping out. If you have warm jackets that you don’t reach for anymore, you can donate them at CREB® Campus from Oct. 30 to Jan. 21.

We are approaching the coldest months of the year and there are many Calgarians that don’t have winter jackets or the means to buy one.

By donating your previously loved winter jackets, you will spread the warmth and help the Drop-In Centre support more Calgarians in need.

Address: 300 Manning Road N.E. Calgary, Alberta T2E 8K4, Canada

Read

What the Bank of Canada’s 50-bps rate cut means for borrowers?

With the Bank of Canada announcing yet another interest rate cut—a half-point reduction this morning—its key policy rate has now fallen to a two-year low of 3.75%. This is the fourth rate cut this year, continuing to lower interest costs for those with loans tied to the prime rate.

What this means for variable-rate mortgage holders

If you’ve got a variable-rate mortgage, your interest costs are about to drop—again.

Today’s rate cut works out to roughly $30 less in monthly payments per $100,000 of mortgage debt based on a 25-year amortization. For a typical $400,000 mortgage, that translates to savings of about $120 each month. If you add up the previous cuts this year, your monthly savings have likely grown to over $300 per month since the Bank of Canada started lowering its policy rate from its peak of 5%.

It’s important to note the difference between two types of variable-rate mortgages: fixed payment variable-rate and adjustable-rate.

Adjustable-rate mortgages: With an adjustable-rate mortgage, both your interest rate and your monthly payment change with fluctuations in the prime rate. This means you’ll see an immediate reduction in your next mortgage payment following today’s rate cut. For a $500,000 mortgage, expect to save about $150 per month after the prime rate falls.

Fixed-payment variable-rate mortgages: With this type of mortgage, your monthly payment stays the same even when interest rates fluctuate. However, the portion of your payment that goes towards interest versus principal will change. With today’s rate cut, more of your payment will go toward reducing your mortgage principal, meaning you’ll pay off your mortgage slightly faster.

What about fixed-rate mortgages?

For those with fixed-rate mortgages, today’s cut won’t directly impact your current payments, since your rate is locked in for the term.

But fixed rates have already seen their own reductions in the past few months. While the trajectory hasn’t been a straight line, lenders have steadily been cutting fixed mortgage rates, coinciding with the steady decline in Government of Canada bond yields, which lead fixed mortgage rate pricing.

While a rise in bond yields earlier this month caused some lenders to start raising fixed mortgage rates, experts think the downward trend will resume.

“Bond yields continued to fall last week as investors raised their bets on a 0.50% rate cut by the BoC…” wrote rate expert Dave Larock in his latest blog post.

“Lenders have already started to lower their fixed rates in response, and it shouldn’t take too much longer for the round of fixed-rate hikes we saw two weeks ago to completely unwind.”

HELOCs and personal lines of credit

Today’s rate cut isn’t just good news for mortgage holders. If you have a Home Equity Line of Credit (HELOC) or a personal line of credit, you’re in for some savings too.

These products are tied to the prime rate, which usually adjusts in line with the Bank of Canada’s rate changes. As prime rates drop, the interest costs on your line of credit will follow suit, putting more money back in your pocket each month.

Based on the average HELOC balance of $37,500, according to recent data from Mortgage Professionals Canada, borrowers would see a reduction in interest costs of around $18 per month following today’s 50-bps rate cut. This is assuming the prime rate falls to around 5.95% at most major lenders.

What’s next?

Most economists expect the Bank of Canada to keep cutting rates at its final policy meeting in December, and further into 2025.

As we recently reported this week, some big banks are adjusting their forecasts to reflect deeper rate cuts by the end of next year.

RBC, National Bank, and Caisse Desjardins are predicting an additional 175 basis points (1.75 percentage points) of rate relief by the end of 2025, which would bring the Bank’s policy rate down to 2.00%. That could translate into a prime lending rate of around 4.20% at most major lenders.

Now’s a great time to review your mortgage strategy. If you’re thinking about whether to stick with variable or lock into a fixed rate, your mortgage broker can help you decide what’s best based on your unique situation.

Read

Calgary Auburn Bay Community Update

Auburn Bay Community Statistics Summary

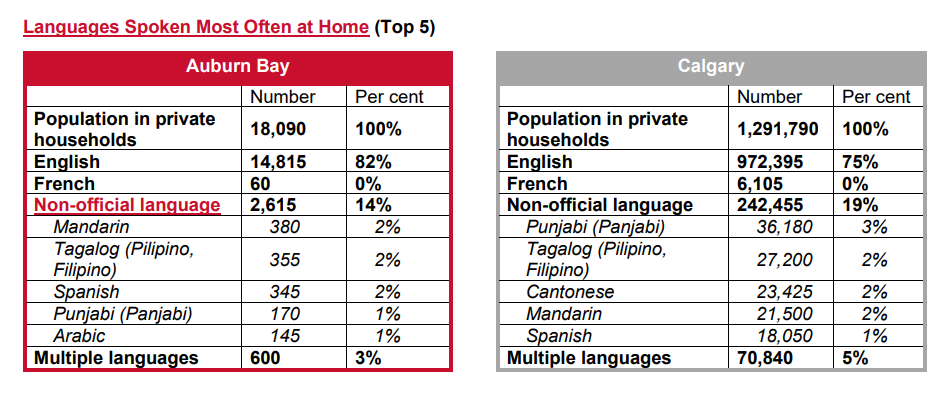
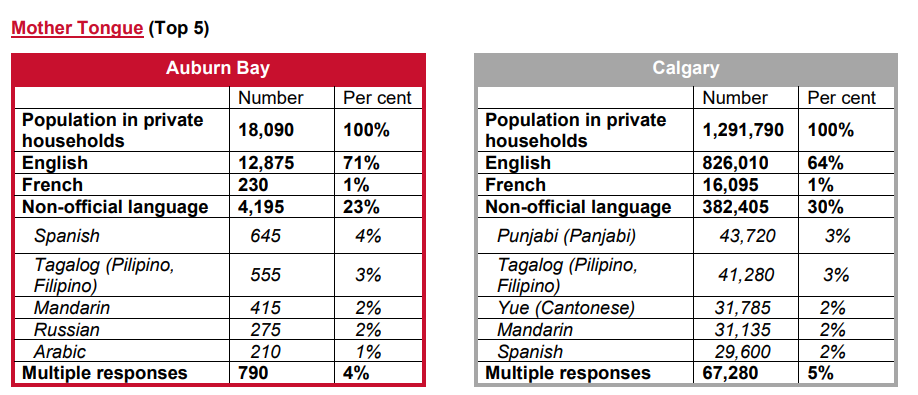
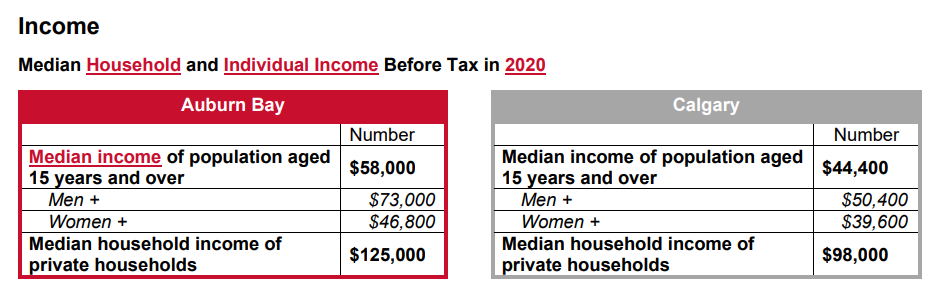
Auburn Bay is a vibrant lake community located in Calgary’s southeast quadrant, known for its family-friendly atmosphere and appealing amenities. As of 2023, the neighborhood continues to attract a diverse range of residents, from young professionals to families.

Population and Demographics: Auburn Bay has a population of approximately 10,000 residents. The community is predominantly made up of families, with a significant percentage of residents aged 30 to 40. This demographic is drawn to the area for its excellent schools, recreational facilities, and safe environment.

Housing Market: The real estate market in Auburn Bay remains robust, with various housing options available. The average home price is around $480,000, with properties typically ranging from $350,000 for townhomes to over $700,000 for larger single-family homes. The average days on market for homes is about 30 days, indicating a competitive market.

Amenities: Auburn Bay features a private lake, parks, and numerous walking and biking trails, promoting an active lifestyle. Key amenities include:

  • Schools: Several highly-rated schools serve the community, making it an attractive choice for families.

  • Recreation: The Auburn Bay Residents Association offers access to community events, activities, and the lake, enhancing community engagement.

  • Shopping and Services: Residents enjoy convenient access to shopping centers and services within a short drive.

Transportation: Auburn Bay is well-connected to major roadways and public transit options, providing easy access to downtown Calgary and surrounding areas.

Overall, Auburn Bay combines natural beauty, modern conveniences, and a strong sense of community, making it a desirable place to live in Calgary. As the area continues to grow, it remains an attractive option for potential homebuyers and investors alike. 

Contact us for a Free Home Evaluation.

For latest community market report, SIGNUP HERE.

Contact us for a Free Home Evaluation.

For latest community market report, SIGNUP HERE.

Read
Data is supplied by Pillar 9™ MLS® System. Pillar 9™ is the owner of the copyright in its MLS®System. Data is deemed reliable but is not guaranteed accurate by Pillar 9™.
The trademarks MLS®, Multiple Listing Service® and the associated logos are owned by The Canadian Real Estate Association (CREA) and identify the quality of services provided by real estate professionals who are members of CREA. Used under license.