RSS

BoC Holds Key Interest Rate Again

The Bank of Canada kept its key overnight lending rate at 2.75% again Wednesday.

This marks the second straight hold after the central bank’s rate-cutting streak of seven consecutive reductions ended in April amid the trade war with the U.S. that is wreaking havoc on Canadian monetary policy.

In recent months, the BoC has adopted a strategy that puts more emphasis on assessing short-term impacts, such as economic shocks, economic shocks, rather than usual long-term outlooks when considering whether to hike, hold or cut rates.

The BoC maintained the hold because the bank’s governing council wants to get more information on how U.S. tariffs on Canadian imports could further affect Canada’s economy, BoC Governor Tiff Macklem said during a news conference after Wednesday’s decision.

The hold and Macklem’s comments came on the same day that U.S. President Donald Trump imposed a 50% tariff on steel imports from Canada and a number of other countries, with the exception of the U.K.

“Uncertainty remain high,” Macklem told reporters.

BMO Chief Economist Douglas Porter told The Canadian Press that the uncertainty “really is a doubled-edged sword” for the BoC.

“It doesn’t mean that they should cut more or less,” Porter told CP. “It just makes it more and more uncertain, and they almost have to take it on a meeting-by-meeting basis.”

The hold was widely expected.

First-quarter Canadian economic growth exceeded the bank’s expectation, but compound growth came in as anticipated, Leslie Preston, a TD Bank managing director and senior economist, wrote in a research note provided to Connect. She noted that the economy is softer but not sharply weaker. However, the bank remains concerned about unexpected firm inflation and its preferred measures of inflation have risen.

The BoC also expects the economy to be “considerably weaker” in the second quarter as strong exports and inventories reverse while demand remains “subdued.”

“We expect that barring a trade negotiation miracle with the Trump administration, Canada’s economy is likely to tip into recession this year, and more interest-rate cuts will be required,” wrote Preston.

                                                                                                                                                                                                                                   By: Monte Stewart @Connect Canada

More Real Estate news or market reports, please check here.

Contact us for a Free Home Evaluation.

Read

Calgary Real Estate Market Update - May 2025

Price adjustments mostly driven by apartment and row style homes

Thanks to steep pullbacks in the apartment condominium sector, total residential sales in Calgary eased by 17 per cent compared to May of last year. While the drop does seem significant, the 2,568 sales this month remain 11 per cent higher than long-term trends for May and improved over last month.

New listings continued to rise this month compared to sales, resulting in further gains in inventory levels. However, the monthly gain in both inventory and sales prevented any significant change in the months of supply compared to April. With 2.6 months of supply, conditions are still relatively balanced. 

“Compared to last year, easing sales and rising inventories are consistent trends across many cities, as uncertainty continues to weigh on housing demand. However, prior to the economic uncertainty, Calgary was dealing with seller market conditions, and the recent pullbacks in sales and inventory have helped shift us toward balanced conditions taking the pressure off prices,” said Ann-Marie Lurie, Chief Economist at CREB®. “This is a different situation from some of the other larger cities, where their housing markets were struggling prior to the addition of economic uncertainty.”    

Last year there was limited inventory across most property types and price ranges. Recent inventory gains are creating pockets of the market that are struggling with too much supply while in other areas supply levels are still low relative to the demand, resulting in divergent trends in home prices.

Both detached and semi-detached home prices have remained relatively stable this month and are still higher than last year’s levels. Meanwhile, row and apartment style homes have reported modest monthly price declines and May prices remain below last year’s levels, as improved new home and rental supply is weighing on resale prices. Overall, the total residential unadjusted benchmark price in Calgary was $589,900, slightly lower than last month and over two per cent below May 2024 levels.   

Detached

New listings in May rose to 2,419 units, with most of the gains driven by homes priced over $600,000. At the same time, sales activity has slowed across most price ranges, supporting a shift toward more balanced conditions and relative stability in prices. However, districts that are facing more competition from new home product or are seeing a larger pullback in demand are starting to show some signs of elevated supply.

The North East district has seen the largest pullback in resale sales activity combined with some of the highest gains in new listings. This has driven the sales-to-new listings ratio down to 41 per cent and the months of supply was nearly four months in May. This is causing prices to ease in the North East, offsetting some of the gains reported in the City Centre, West, and North West districts. City-wide the unadjusted benchmark price in May was $769,400, similar to last month, one percent higher than last May, and still above last year’s seasonal peak price.  

Semi-Detached

The 428 new listings in May were met with 256 sales, causing the sales-to-new-listings ratio to rise to 60 per cent this month. This slowed the pace of inventory growth and the months of supply remained just above two months.  Semi-detached homes continue to remain less than 10 per cent of all sales and inventory levels in the city.

This in part is due to construction patterns shifting toward more row style properties over semi-detached, and is one of the reasons we do not see the same inventory build as row and apartment style homes. 

Like the detached market there is significant variation within the city districts. The North East has the highest months of supply at nearly three months and is reporting some price declines, while the tightest conditions are in the North West, where prices continue to rise. Overall, generally tighter conditions are still supporting price gains for semi-detached properties. In April the unadjusted benchmark price was $697,300, a monthly gain of less than one per cent, nearly three per cent higher than last year’s levels and above last year’s seasonal peak.

Row

Row home sales have eased over last year’s near record high pace but stayed well above long-term trends.  However, the gain in new listings has continued to cause further inventory gains. For the second month in a row, inventory levels were over 1,000 units; we have not seen this much inventory for row units since 2021.

While inventory levels have improved across all districts, we are starting to see higher months of supply in the North East district at 3.5 months, resulting in some downward pressure on prices. The North, North West and South areas have also reported higher year-over-year pullbacks in resale prices, as improved supply choice for new properties are impacting resale activity. Overall, the benchmark price in May was $453,600, down over last month, nearly two per cent below last May, and lower than last year’s seasonal high.  
 

Apartment Condominium

Sales this month totaled 579 units, a significant decline over last May’s record high of 907 units. While new listings were lower than levels reported last year, they remained high compared to sales, causing the sales-to-new listings ratio to drop to 47% this month. This contributed to further inventory gains and drove the months of supply up to 3.6 months.

High levels of apartment rental units under construction are adding to the rental supply and contributing to rent adjustments. This is likely slowing condo ownership demand coming from existing renters and potential investors, contributing to some of the shifts witnessed in the apartment condominium sector. 

More supply choice is also weighing on condominium prices. In May the benchmark price eased to $335,300, down from last month and over one per cent lower than last year. The steepest declines are occurring in the North East and South East districts, where competition from the new home market is weighing on resale pricing. While prices have eased and are below peak levels, recent declines have not offset the double-digit gains reported over the past two years.

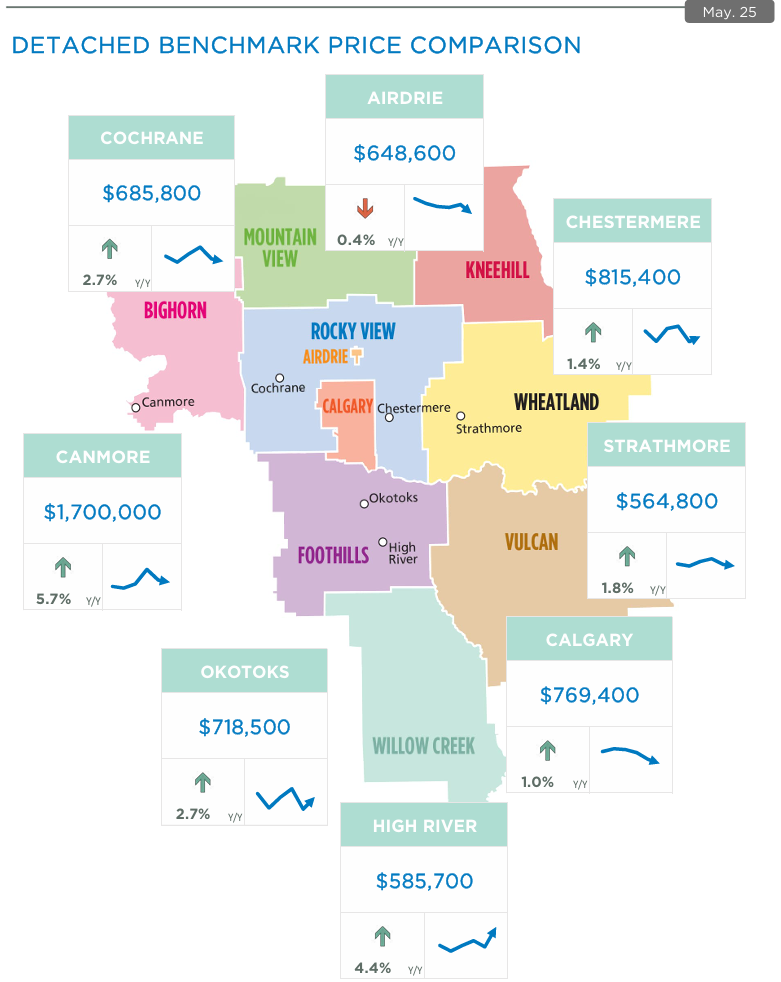
REGIONAL MARKET FACTS


Airdrie

While improving over last month, May sales eased compared to last year, contributing to the year-to-date decline of 10 per cent. However, the 772 sales so far this year are consistent with long-term trends in Airdrie. At the same time new listings continue to rise causing the sales-to-new listings ratio to fall to 58 per cent, still well within balanced conditions, but a significant change from the over 90 per cent ratio reported last year. Recent shifts in sales and new listings have supported gains in inventory levels.

In May there were 468 units in inventory, reflecting the highest May reported since prior to the pandemic. The shift in supply is in part related to the surge in new construction providing more options for potential consumers. Additional supply choice is impacting price growth.  The total residential benchmark price was $540,600 in May, down nearly one per cent over last month and nearly two per cent below last year’s levels.

Cochrane

Sales in Cochrane were fairly resilient until this month, where sales were 17 per cent slower than last year. The decline was enough to cause year-to-date sales to ease to levels just below those reported last year.  At the same time, this month new listings surged, driving the sales-to-new listings ratio down to 55 per cent and supporting further inventory gains.  With 293 units available in May, levels are more consistent with long-term trends. The months of supply neared three months in May and while this did slow the pace of price growth, the total residential benchmark price of $589,400 is still nearly four per cent higher than last May.

Okotoks

A boost in new listings this month supported a surge in sales activity. However, with a sales-to-new-listings ratio of 74%, inventory levels did not change much over last month and the months of supply once again dropped below two months. Okotoks has struggled to add supply at the pace reported in Calgary, Cochrane and Airdrie and sales growth has been dampened by limited supply choice.

While there have been some improvements in inventory levels, as of May levels remained nearly 28 per cent below long-term trends for the city.  The limited supply choice given the relatively strong demand has continue to support some price growth in the town. As of May the unadjusted benchmark price was $633,900, up over last month and over two per cent higher than last year. 

Click here to view the full City of Calgary monthly stats package.

Click here to view the full Calgary region monthly stats package.

Read

Auburn Bay Real Estate Market Update - May 2025

In May 2025, Auburn Bay experienced a noticeable slowdown in sales volume but a sharp increase in listings and inventory. This shift has begun to push the market toward more balanced conditions, especially in the apartment and detached segments.

  • Total Sales: 41 (▼20% YoY)

  • New Listings: 89 (▲27% YoY)

  • Total Inventory: 102 (▲149% YoY)

  • Months of Supply: 2.49 (▲209% YoY)

  • Benchmark Residential Price: $628,800 (▼3.7% YoY)


🏠 Performance by Property Type

🔹 Detached Homes

  • Sales: 18 units (▼25% YoY)

  • New Listings: 46 (▲15%)

  • Benchmark Price: $814,400 (▼1% YoY, slight monthly uptick)

  • Months of Supply: 2.56 (up 145% YoY)

  • Sales-to-Listings Ratio: 39% → Buyer's market pressure

  • Market Trend: Slower sales, rising inventory; sellers must be price competitive and property-ready.

🔹 Semi-Detached Homes

  • Sales: 4 units (▼33% YoY)

  • Benchmark Price: $531,600 (Flat YoY)

  • New Listings: 7 (▲17%)

  • Months of Supply: 1.5 (▲350%)

  • Sales-to-Listings Ratio: 57%

  • Market Trend: Limited inventory but sluggish buyer activity. A stable price environment, but fewer active sales.

🔹 Row Homes (Townhouses)

  • Sales: 9 units (▲50% YoY)

  • Benchmark Price: $472,000 (No YoY change)

  • New Listings: 9 (▲13%)

  • Sales-to-Listings Ratio: 100% → Balanced/Strong market

  • Months of Supply: 1.78 (▲113%)

  • Market Trend: Solid demand keeps this segment competitive; popular among downsizers and young families.

🔹 Apartments

  • Sales: 10 units (▼33% YoY)

  • Benchmark Price: $363,800 (▼5% YoY)

  • New Listings: 27 (▲69%)

  • Months of Supply: 3.4 (▲467%)

  • Sales-to-Listings Ratio: 37%

  • Market Trend: High inventory levels and price softness signal strong buyer leverage.


🏫 Schools in Auburn Bay

Auburn Bay is a family-oriented lake community with access to excellent schools:

  • Auburn Bay School (K–4) – Calgary Board of Education

  • Prince of Peace School (K–9) – Calgary Catholic School District

  • Lakeshore School (Grades 5–9) – Opened recently to serve the growing SE population

Nearby schools in Mahogany and Seton also support Auburn Bay families, offering options for French immersion and high school programs.


🌟 Community Features & Events

Auburn Bay is designed around a 43-acre freshwater lake, making it one of Calgary’s premier four-season lifestyle communities. Key features include:

  • Auburn House – The private lake-access community center with gym, rental halls, skating rinks, paddleboats, and beach access.

  • Auburn Bay Dog Park – A large off-leash area for pet owners.

  • Seton Urban District – Within minutes, offering the South Health Campus, YMCA, Cineplex, shopping, and dining.

  • Pathway Connections – Interwoven green spaces, bike trails, and parks make it an active living hub.

  • Neighbour Day BBQ (June 15): Family event with food trucks and music.


📌 Key Insights for Buyers & Sellers

✅ For Buyers:

  • Detached and apartment buyers have strong negotiating power due to rising inventory.

  • Row homes offer solid value and competition is stronger; act quickly when new listings hit.

  • Get pre-approved and work with a local expert to stay ahead of pricing shifts.

✅ For Sellers:

  • Price competitively and prepare for more Days on Market in most segments.

  • Highlight Auburn Bay lifestyle features (lake access, schools, walkability).

  • Focus on condition, staging, and professional marketing to stand out.


The Auburn Bay market in May 2025 is shifting toward balance, with increased inventory and slower sales in most segments. However, demand for affordable, lifestyle-oriented housing such as row homes remains strong. Sellers need to be strategic, and buyers have emerging opportunities — particularly in detached and apartment categories.

Read

Calgary Top 5 In-Demand Communities in May 2025

In May 2025, Calgary saw a surge of demand for detached homes, with several properties selling within just a few days of hitting the market. These quick sales were typically characterized by competitive pricing, desirable styles (especially bungalows and bi-levels), and well-located communities.

📌 Key Highlights:

  • Fastest-Selling Communities by volume:

    • Brentwood led the city with 6 fast sales, averaging $831,379 per home.

    • West Hillhurst, Varsity, and Oakridge followed, each with multiple quick transactions.

  • Property Styles:

    • Bungalows dominated the market, prized for their single-level layouts.

    • Bi-levels and 4-level splits were also popular, especially in suburban neighborhoods.

  • Size and Price:

    • Average size for fast-selling homes ranged from 750 to over 2,000 sq ft.

    • The highest price per square foot was recorded in West Hillhurst at $1,038/sqft, due to smaller but high-value inner-city properties.

  • Price vs. List:

    • Many homes sold at or above list price, indicating a competitive environment.

    • Example: A property in Penbrooke Meadows listed at $399,900 sold in just 4 days for $350,000 — a quick transaction despite a discount, likely due to location or condition factors.

    • Conversely, a home in West Hillhurst sold at asking price of $990,000 in 1 day, reflecting strong buyer demand.

🏡 Sample of Quick Sales:

📊 Sold Price vs Listing Price Analysis

Homes that sold quickly often did so in a competitive pricing environment. We calculated the Sold-to-List Price Ratio (Sold Price ÷ Listing Price), a key metric to understand market demand and pricing strategy:

  • 🔼 Over List Price (Ratio > 100%):
    ~31% of quick-sale homes sold above their listing price, suggesting bidding wars or underpricing strategies.
    Example:

    • Brentwood Bungalow – Listed at $699,900, sold for $750,000107.1% of list price

    • Southview Bungalow – Listed at $399,900, sold for $430,000107.5%

  • ⚖️ At List Price (Ratio ≈ 100%):
    Around 44% of homes sold at list price, indicating accurate market pricing.
    Example:

    • Oakridge Bungalow – Listed and sold at $849,900100%

  • 🔽 Below List Price (Ratio < 100%):
    The remaining 25% sold below asking, often due to condition, location, or aggressive negotiation.
    Example:

    • Penbrooke Meadows Bi-Level – Listed at $399,900, sold for $350,00087.5%


📌 Top Performing Communities by Price Strength

🔍 Insight Summary

  • Buyers acted fastest in Brentwood, which also had the highest number of quick sales.

  • Bungalows remain the dominant preference, likely due to accessibility, layout efficiency, and lot size.

  • Homes in inner-city and well-established areas (West Hillhurst, Varsity) sold especially fast, often at or above list price.

  • Accurate pricing continues to be crucial. Homes priced close to market value are selling at or above list within days.

What happened in Auburn Bay in May 2025, please find market update here.

Read
Data is supplied by Pillar 9™ MLS® System. Pillar 9™ is the owner of the copyright in its MLS®System. Data is deemed reliable but is not guaranteed accurate by Pillar 9™.
The trademarks MLS®, Multiple Listing Service® and the associated logos are owned by The Canadian Real Estate Association (CREA) and identify the quality of services provided by real estate professionals who are members of CREA. Used under license.