RSS

McKenzie Lake Real Estate Market Summary – Q1 2025

McKenzie Lake experienced a strong and competitive market in Q1 2025, driven by limited inventory and continued demand from buyers seeking established communities with lake access and family-friendly amenities. The market leaned towards seller-friendly conditions, particularly in the detached home segment.

  • Benchmark Price: $659,933

    • ▲ 3.4% year-over-year increase

    • ▲ 0.4% quarter-over-quarter increase

  • Total Sales: 30

  • New Listings: 42

  • Inventory: 18

  • Sales-to-New Listings Ratio: 71%

  • Months of Supply: 1.8 (indicative of a tight market)

  • Days on Market: Average of 20 days


🏘️ Market Trends

🔹 Detached Homes

  • Strongest performing segment in McKenzie Lake.

  • Benchmark price: $692,567

    • ▲ 3.9% year-over-year

    • ▲ 0.4% quarter-over-quarter

  • High demand driven by families seeking space, yards, and access to the private lake and recreational amenities.

  • Low inventory has created upward pressure on prices.

🔹 Semi-Detached

  • Benchmark price: $574,467

    • ▲ 4.4% year-over-year (highest appreciation among all types)

    • ▼ 0.2% quarter-over-quarter

  • Price growth has been robust year-over-year, though there was a slight correction from the previous quarter.

  • Popular among downsizers and couples looking to stay in the area without maintaining a large property.

🔹 Row (Townhomes)

  • Benchmark price: $409,367

    • ▲ 4.3% year-over-year

    • ▲ 0.2% quarter-over-quarter

  • Strong interest from first-time buyers and investors.

  • Represents one of the most affordable entry points into the McKenzie Lake market.

🔹 Apartment Condos

  • Benchmark price: $290,800

    • ▲ 8.0% year-over-year

    • ▲ 2.5% quarter-over-quarter (largest Q/Q increase)

  • Demand has surged due to affordability and low vacancy rates in Calgary’s rental market.

  • Attracts singles, seniors, and investors seeking lower-maintenance living.


📰 McKenzie Lake Real Estate News & Trends

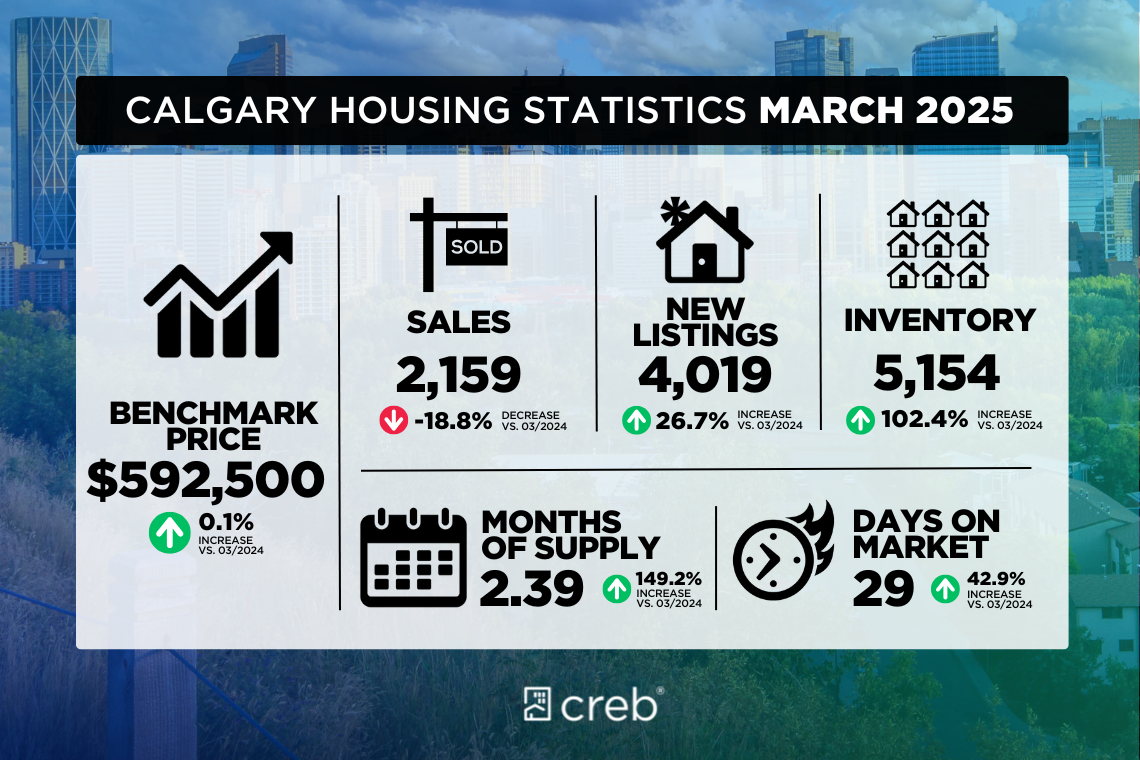
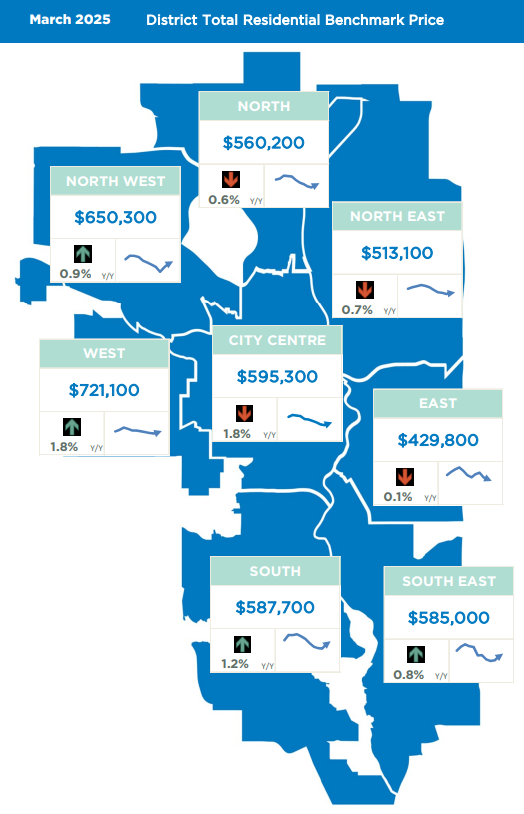
  • Calgary’s housing market remains active with limited supply and high competition, especially in the Southeast.

  • Mortgage rate expectations for possible cuts later in the year have encouraged more buyers to enter the market early.

  • McKenzie Lake's desirability is enhanced by lake privileges, proximity to Fish Creek Park, top-rated schools, and access to Deerfoot and Stoney Trail.


🎉 Community Past Events & Highlights

  • Winter Fest at McKenzie Lake Beach Club: Hosted in February, this annual event drew strong community participation with ice skating, fire pits, and family activities, reinforcing the area's strong community spirit.

  • Neighbourhood Watch Expansion: Community involvement has increased with new safety initiatives and better lighting in public areas.

  • School Enrollment Growth: Local schools like McKenzie Lake School and Mountain Park School reported increased registrations, suggesting continued family migration into the area.


📌Expectations remain positive heading into spring:

  • Increased listings typical of the season may slightly ease pressure on buyers.

  • Price growth is likely to continue modestly, especially for detached and apartment-style properties.

  • Investor interest in apartment condos and townhomes is expected to grow further as Calgary remains a top Canadian destination for migration.

Read

Rangeview Real Estate Market Summary – Q1 2025

The Rangeview real estate market in the first quarter of 2025 has remained resilient, with steady demand across various property types. The community’s appeal continues to grow due to its blend of modern suburban living and access to green spaces. Buyer interest remains strong despite fluctuating interest rates, and new development projects are shaping the neighborhood’s landscape.

Market Trends

Detached Homes

Detached homes continue to dominate the market, with a 4% increase in average sale prices compared to the same period in 2024. The average price for a single-family home is now around $720,000. New construction homes with energy-efficient features and smart home technology are in high demand, particularly in newer phases of development.

Townhomes

The townhome segment has seen moderate growth, with a price appreciation of approximately 3% year-over-year. The average sale price for townhomes in Rangeview is now about $460,000. First-time homebuyers and downsizers are the main drivers of demand, seeking affordable alternatives to detached homes without sacrificing space and amenities.

Apartments

Condominium sales have remained stable, with slight price increases. The average condo price in Rangeview is around $340,000, marking a 2% rise from Q1 2024. Higher mortgage rates have led some buyers to opt for condos as a more budget-friendly option, contributing to a balanced market.

Rangeview Real Estate News

  • New Commercial Developments: A new mixed-use development is underway, featuring retail spaces, dining options, and office buildings. This project is expected to enhance property values and convenience for residents.

  • Infrastructure Upgrades: Road expansions and public transit improvements have been announced, providing better connectivity to downtown and surrounding areas.

  • Sustainable Housing Trends: Builders are increasingly incorporating eco-friendly designs, including solar panels, high-efficiency insulation, and smart energy management systems, which are attracting environmentally conscious buyers.

  • Rental Market Growth: With rising home prices, rental demand has increased, leading to a 5% rise in rental rates for townhomes and condos compared to Q1 2024. Investors are showing keen interest in Rangeview’s rental market, particularly in multi-unit developments.

Rangeview’s real estate market remains strong, with steady price growth and continued interest from homebuyers and investors. While economic conditions and interest rates may impact affordability, the community’s ongoing development and infrastructure improvements are expected to sustain demand in the coming months.

Contact us for a Free Home Evaluation.

For the latest community market report, SIGNUP HERE.

Read

🏡 Harvest Hills Real Estate Market Summary – Q1 2025

Harvest Hills displayed strong momentum in Q1 2025, with a sharp resurgence in both listings and sales activity:

  • Sales: 41 (↑156.25% Y/Y)

  • New Listings: 52 (↑173.68% Y/Y)

  • Sales-to-New-Listings (SNL) Ratio: 78.85% – suggests a strong seller’s market.

  • Average Days on Market: 33 days (↑33.61% Y/Y)

  • Months of Supply: 1.44 (historically low; Q1 10-year avg = 2.51)

  • Benchmark Price (Total Residential): $539,733 (▼0.4% Y/Y)

Despite the increase in inventory (↑436% Y/Y), months of supply remain tight, keeping pressure on prices, especially in desirable home segments.


📊 Market Trends

🏠 Detached Homes

  • Sales: 22 (↑100% Y/Y)

  • Benchmark Price: $631,067 (↑3.9% Y/Y)

  • Average Price: $653,132 (↑4.2% Y/Y)

  • Median Price: $639,000 (↑0.9% Y/Y)

Detached homes remain the backbone of the Harvest Hills market, with two-storey models comprising 78.7% of all detached transactions. Prices continue to climb amid tight inventory and strong demand from upsizers.

🏘️ Row Houses

  • Benchmark Price: $427,500 (↑0.62% Y/Y)

  • Median Price: $474,850 (▼9.98% Y/Y)

  • Average Price: $505,000 (▼3.91% Y/Y)

Row homes remain a more affordable option but showed price softening, likely due to broader selection and buyer negotiation room. Nevertheless, their popularity is buoyed by demand from downsizers and young families.

🏢 Apartments

  • Benchmark Price: $402,700 (↓0.58% Y/Y)

  • Apartments saw modest decline in value and remain the entry point for new buyers or investors, though they now make up a smaller share (approx. 25%) of the total market.

🔗 Semi-Detached

  • No benchmark price was recorded for Q1 2025, indicating limited sales volume. Historically, this segment has been small and volatile in Harvest Hills.


🧭 Community Highlights & Developments

Harvest Hills continues to attract residents thanks to its prime location near major corridors (Deerfoot Trail & Country Hills Blvd) and proximity to YYC International Airport and large shopping amenities like Country Hills Town Centre.

Key community notes:

  • The Harvest Hills Lake area and surrounding green spaces remain a big draw for buyers looking for family-oriented or nature-accessible living.

  • Planned enhancements to nearby Vivo Recreation Centre and retail corridors in 2025 may continue to boost demand and livability appeal.

  • Several neighborhood groups reported increased local engagement this quarter, including volunteer clean-ups and spring markets.


🔮 Outlook for 2025

Harvest Hills enters Q2 2025 with strong market momentum. While detached homes are clearly leading the way, the row and apartment segments may continue to experience volatility due to affordability pressures and inventory adjustments.

Sellers are in a favorable position, particularly those listing modernized detached or renovated row homes, while buyers are advised to act decisively, especially as inventory remains constrained.

Read

McKenzie Towne Real Estate Market Summary – Q1 2025

McKenzie Towne’s real estate market in Q1 2025 showed moderate cooling compared to the last quarter of 2024, though it remains relatively active. Inventory increased slightly, giving buyers more options and leverage, especially in certain property types. Prices, while mostly stable, saw varied shifts depending on property classification.

  • Total Sales (Q1 2025): 58 homes

  • Average Sale Price: $474,188

  • Sales-to-List Price Ratio: 98.2%

  • Average Days on Market: 25 days


🏠 Detached Homes

  • Number of Sales: 17

  • Average Price: $607,647

  • Price per Square Foot: $383

  • Average Days on Market: 21

Trend: Detached home sales remained strong, with consistent buyer interest due to limited supply and desirable lot sizes. Prices rose modestly from Q4 2024, driven by demand for family-sized homes and modernized interiors.


🏘️ Semi-Detached Homes (Duplexes)

  • Number of Sales: 5

  • Average Price: $489,400

  • Price per Square Foot: $397

  • Average Days on Market: 12

Trend: Duplexes moved quickly this quarter, with the shortest average DOM (Days on Market) of all property types. These properties are especially appealing to first-time buyers and downsizers looking for affordability without sacrificing space.


🏢 Row/Townhomes

  • Number of Sales: 17

  • Average Price: $378,388

  • Price per Square Foot: $352

  • Average Days on Market: 24

Trend: Townhomes were the most active segment, matching detached home sales. Their balance of price and square footage remains appealing. Prices stayed relatively flat, though homes with recent renovations or attached garages commanded a premium.


🏙️ Apartments

  • Number of Sales: 19

  • Average Price: $284,232

  • Price per Square Foot: $374

  • Average Days on Market: 33

Trend: Apartments had the highest volume of listings and longest time on market. Price growth was minimal, and many units faced stiff competition. Units with updated interiors and west-facing balconies saw quicker sales and slightly better pricing.


📰 McKenzie Towne community News

  • Inventory Rise: Calgary’s southeast sector, including McKenzie Towne, experienced a noticeable increase in new listings. This is partly attributed to interest rate stabilization, encouraging move-up buyers to list their current homes.

  • Affordability Pressure: The ongoing affordability crunch in central Calgary is pushing buyers further out to communities like McKenzie Towne, especially for family-friendly layouts and walkable neighborhoods.

  • Community Appeal: McKenzie Towne remains a favorite for young families and retirees, thanks to its pedestrian-friendly design, parks, and proximity to major roads and shopping hubs.

  • Rental Demand: Investors continue to show interest, especially in townhomes and apartments, due to strong rental demand from younger professionals priced out of homeownership.


🔮 Outlook for Q2 2025

  • Buyers can expect slightly more negotiating power, especially in the condo market.

  • Sellers of detached and semi-detached homes should still find success if priced competitively.

  • Watch for rate announcements and employment trends in Calgary to gauge how demand might shift through spring and summer.

Read

Calgary Real Estate Summary — Panorama Hills NW Q1 2025

📊 Overall Market Snapshot

  • Total Sales: 76
    (⬇️ 18.3% year-over-year)

  • New Listings: 119
    (⬆️ 20.2% year-over-year)

  • Sales-to-New Listings Ratio: 63.87% – indicating a balanced but slightly buyer-favorable market

  • Average Inventory: 54 (⬆️ 172.88% YoY)

  • Months of Supply: 2.12 months (⬆️ 233.92% YoY)

  • Average Days on Market (DOM): 39 days (⬆️ 128.54% YoY)

  • Benchmark Price (Total Residential): $540,033
    (⬇️ 4.11% year-over-year)


🏘️ Market Trends

🏠 Detached Homes

  • Benchmark Price: $772,567 (⬆️ 3.1% YoY)

  • Median Price: $757,500 (⬆️ 0.8%)

  • Average Price: $755,267 (⬇️ 3.33%)

  • Sales Volume: 21 (⬇️ 36.4% YoY)

  • Months of Supply: 2.48

  • DOM: 33 days

💡 Detached homes remain the highest-priced segment. While benchmark values are climbing, average sale prices dipped slightly, indicating more sales in the mid-range. Demand is steady but easing, with longer selling times and higher supply.

🏘️ Semi-Detached Homes

  • Benchmark Price: $560,400 (⬆️ 1.23% YoY)

  • Median Price: $570,250 (⬇️ 2.96%)

  • Average Price: $559,000 (⬇️ 7.07%)

  • Months of Supply: ~3.45

💡 A cooling trend seen in both average and median prices. Listings are up while sales are softening, creating longer sell cycles. Strategic pricing is key.

🏘️ Row (Townhomes)

  • Benchmark Price: $408,867 (⬆️ 1.1% YoY)

  • Median Price: $426,811 (⬆️ 8.76%)

  • Average Price: $434,250 (⬆️ 5.86%)

💡 One of the best-performing segments in Q1. Prices are climbing steadily, indicating increasing demand, especially from first-time buyers and downsizers seeking affordable alternatives.

🏢 Apartments

  • Benchmark Price: $306,900 (⬇️ 7.15%)

  • Median Price: $275,750 (⬇️ 9.89%)

  • Average Price: $274,649 (⬇️ 5.05%)

💡 The most affordable segment, but facing downward pressure in both pricing and demand. This is likely due to rising inventory and limited differentiation among listings.


🏫 Panorama Hills NW Community Highlights – Q1 2025

📌 School News

  • Captain Nichola Goddard School initiated a pilot program for enhanced arts integration in STEM subjects this spring.

  • Panorama Hills Elementary launched its Eco-Club’s Spring Clean Initiative, getting kids involved in local green efforts.

  • Notre Dame High School hosted a citywide science competition in March, bringing students across Calgary to compete in robotics and innovation.

🧒 Community & Family Engagement

  • Parent Council groups have been active in funding new playground improvements and digital resource upgrades across schools.

  • Books & Breakfast” morning events at schools saw record attendance, building stronger family-school connections.


🔮 Q2 2025 Outlook

  • Detached and semi-detached homes may see more modest pricing as inventory builds.

  • Townhomes are expected to remain competitive, potentially with further price appreciation.

  • Apartments will continue to be attractive for entry-level buyers but may require incentives to stimulate sales.

  • Community confidence remains high, buoyed by education investment and vibrant youth programs.

Read

Copperfield Real Estate Market Summary – Q1 2025

The first quarter of 2025 in Copperfield, SE Calgary, reflected a dynamic and active real estate market, characterized by rising demand, tight inventory, and moderate price growth across most property types. Despite broader economic pressures such as interest rate fluctuations, Copperfield remains a highly sought-after community for families and first-time buyers.


📊 Market Trends

1. Single-Family Detached Homes

  • Benchmark Price: $571,167 (↑ 11.1% year-over-year)

  • Sales Activity: Increased 10.3% year-over-year

  • Trend: The market for detached homes continued to tighten, with inventory levels down to just 1.1 months of supply. This indicates strong seller control.

  • Buyer Profile: Primarily families seeking more space amid remote/hybrid work trends.

2. Semi-Detached Homes

  • Benchmark Price: $508,300 (↑ 13.6% year-over-year)

  • Sales Activity: Sales rose modestly, but inventory dropped by nearly 18%.

  • Trend: Semi-detached homes saw the highest price growth among all property types in Copperfield. Buyers are attracted to their balance of space and affordability.

3. Row/Townhomes

  • Benchmark Price: $421,000 (↑ 17.2% year-over-year)

  • Sales Activity: Demand surged with many buyers priced out of detached options.

  • Trend: Low inventory (down 21.7%) has led to increased competition and multiple offers. Entry-level buyers are the primary drivers.

4. Apartment Condominiums

  • Benchmark Price: $291,467 (↑ 16.5% year-over-year)

  • Sales Activity: Strongest growth in sales volume (+15.2%)

  • Trend: The condo segment benefited from improved affordability and investor activity, especially with more renters transitioning to ownership amid rising rents.


📉 Inventory & Sales Summary

  • Total Sales: Up across all property types.

  • Total Inventory: Down 16.3% from Q1 2024.

  • Sales-to-New Listings Ratio: 82.5% (seller’s market territory)

  • Average Days on Market: Decreased, with most listings seeing offers within 15–20 days.


📰 Copperfield Local Real Estate News & Influences

  1. New Construction Projects

    • Several infill and townhouse developments launched in late 2024 are attracting attention in early 2025, particularly from downsizers and young couples.

  2. Transit-Oriented Appeal

    • Proximity to future Green Line LRT expansion plans continues to bolster long-term value perceptions in Copperfield, making it a magnet for buyers looking for growth potential.

  3. Mortgage Rate Sensitivity

    • Interest rate volatility has led to a shift toward more affordable housing types, boosting activity in the condo and rowhome segments.

  4. Community Appeal

    • Copperfield's established parks, schools, and access to Deerfoot Trail and Stoney Trail are reinforcing its status as a family-friendly and commuter-convenient neighbourhood.


Copperfield's Q1 2025 market underscores strong price growth, limited inventory, and broad-based demand, especially for entry-level and mid-range properties. With infrastructure improvements on the horizon and consistent buyer interest, the neighbourhood is poised for continued momentum into the second quarter.

Read

Auburn Bay Real Estate Market Summary – Q1 2025

The Auburn Bay real estate market in the first quarter of 2025 has demonstrated steady growth, with a healthy balance between supply and demand. The community continues to attract buyers due to its lakeside lifestyle, family-friendly amenities, and access to key transportation routes. Despite some economic uncertainties, real estate activity in Auburn Bay remains robust across all property types.

Market Trends:

  • Single-Family Homes: The demand for detached homes in Auburn Bay remains high, with a 4.2% increase in average sale prices compared to Q4 2024. The inventory decreased by 5.8%, leading to competitive bidding, particularly for well-maintained homes with lake access. The number of SOLD listings increased by 6.5%, reflecting strong buyer interest. Average days on market dropped from 31 to 27 days.

  • Townhomes: Townhomes have seen a 3.7% price appreciation, fueled by affordability concerns in the single-family segment. The inventory remained stable, with a minor 0.9% decline due to steady absorption rates. The number of SOLD listings grew by 4.1%, with newer developments performing particularly well. Average days on market remained steady at 29 days.

  • Condominiums: The condo market has seen stable growth, with a 2.5% increase in average sale prices. Inventory levels rose by 3.2%, as new developments and investor activity contributed to supply. The number of SOLD listings increased by 5.3%, with buyers favoring units featuring lake views and enhanced amenities. Average days on market improved slightly from 36 to 34 days.

Overall, the Auburn Bay real estate market remains strong in Q1 2025, with continued demand across different property types. While affordability concerns have shifted some buyers toward more economical housing options, the area remains a prime location for homeowners and investors alike. Future market performance will likely depend on broader economic conditions and interest rate movements, but Auburn Bay continues to stand out as a desirable community in Calgary’s real estate landscape.

Contact us for a Free Home Evaluation.

For latest community market report, SIGNUP HERE.

Read

Mahogany Real Estate Market Summary – March 2025

The Mahogany real estate market in March 2025 has experienced moderate growth, with steady demand across different property types. Despite some economic uncertainties, the community remains a sought-after location due to its lakefront lifestyle, modern amenities, and family-friendly environment.

Market Trends

Detached Homes

Detached homes in Mahogany continue to be the most desirable, with a noticeable increase in both listing prices and sales volume. The average price for a single-family home has risen by 5% year-over-year, currently sitting at approximately $850,000. The demand remains high for properties near the lake, with premium waterfront homes selling significantly above market value.

Townhomes

The townhome market has shown consistent activity, particularly among first-time homebuyers and investors. Prices have increased by approximately 3% compared to March 2024, averaging around $480,000. Low inventory levels have contributed to competitive bidding, driving some sales above asking price.

Apartments

Condominium sales have been stable, with modest price appreciation. The average condo price in Mahogany is around $360,000, reflecting a 2% increase from last year. Buyers are particularly interested in newer developments with modern finishes and close proximity to retail spaces and transit options.

Local Real Estate News

  • New Commercial Developments: A major commercial plaza is set to open later this year, bringing new retail stores, dining options, and professional services to the community. This development is expected to boost property values in nearby areas.

  • Infrastructure Improvements: The city has announced upcoming road expansions and improved public transit access to Mahogany, which will enhance connectivity to downtown and other parts of the city.

  • New Home Construction Trends: Builders are focusing on sustainable and energy-efficient homes, with an increasing number of buyers looking for properties that offer solar panels, smart home features, and eco-friendly materials.

  • Rental Market Growth: With rising home prices, the rental market in Mahogany is also growing. Rental rates for townhomes and condos have increased by approximately 6% year-over-year, making investment properties an attractive option for buyers.

Overall, the Mahogany real estate market remains strong, with rising property values and continued demand across all housing types. While economic factors and interest rates may influence the market in the coming months, Mahogany continues to be a prime location for homebuyers and investors alike.

Contact us for a Free Home Evaluation.

For the latest community market report, SIGNUP HERE.

Read

三月份二手房市场不确定性因素很多

持续的经济不确定性,由关税威胁推动,已影响消费者信心,并对 3 月份的房地产活动造成冲击。销量同比下降 19%,总计 2,159 套。所有房产类型的销售均有所放缓,其中公寓住宅类别的跌幅最为明显。

“考虑到当前的不确定性,销售回落并不令人意外,”CREB® 首席经济学家 Ann-Marie Lurie 表示。“然而,值得注意的是,尽管销量下降,但仍然高于 2015 年至 2020 年期间的水平,当时我们的经济面临重大挑战和大量就业流失。尽管如此,需求的放缓伴随着新增房源的增长和库存的上升,使市场在连续四年卖方占优后逐步恢复平衡。”

3 月份新上市房源超过 4,000 套,使销售与新上市房源的比例降至 54%,这一水平足以支持库存进一步增加。住宅总库存达到 5,154 套,供应月数上升至 2.4 个月。尽管这一变化与去年相比较为显著,但由于所有房产类型和价格范围内的供应仍然有限,目前市场状况在买卖双方之间表现出更好的平衡。然而,市场状况仍然因地理位置、价格区间和房产类型的不同而有所差异。

供应的改善减轻了房价上涨的压力,此前四年房价涨幅较大。3 月份,住宅基准价格达到 $592,500 ,与上个月及去年 3 月的价格基本持平。独立屋和半独立屋的价格仍然维持在历史最高水平,并持续上涨,而公寓和联排别墅的价格则略低于去年的峰值水平。

独立屋(Detached)

3 月份,独立屋销售总计 1,035 套,同比下降 10%。尽管销售下滑,但新增房源有所增加,推动库存较去年极低水平有所回升。相比销售的供应改善,使供应月数上升至略高于 2 个月,相较于去年春季不到 1 个月的水平,这是一个显著改善。然而,对于 70 万以下的房源,供应月数仍然紧张,低于 2 个月。对于 80 万以上的房源,市场正在逐步向更平衡的状态转变。

3 月份独立屋的基准价格达到 $769,800 ,较上月有所增长,并比去年同期高出 4% 以上。供应有限仍然支撑着独立屋价格的上涨,尽管涨幅相较去年两位数的增长有所放缓。其中,市中心的价格涨幅最为显著。


半独立屋(Semi-Detached)

3 月份销售放缓,相比去年同期下降,导致第一季度销量同比下降 11%。销售下降的同时,新上市房源增加。今年前两个月市场仍然相对紧张,但 3 月份新上市房源的增长使库存进一步提升,供应月数上升至 2.2 个月,这是自 2022 年底以来的最高月度水平。

市场向更平衡的状态转变,使得价格增长速度放缓。然而,3 月份市场基准价格达到 $691,900 ,仍比去年同期高出 5% 以上,并超过去年 7 月创下的未调整峰值。全市范围内均出现同比增长,其中市中心和西区涨幅最大。


联排别墅(Row)

3 月份新上市房源大幅增加,达到 697 套。同时,销售量为 400 套,导致销售与新上市房源比例下降,库存水平较去年有所上升。3 月份库存量达到 826 套,高于长期趋势,但仍未达到疫情前的高点。所有价格范围的供应均有所改善,东北区、北区和东南区的增长尤为显著。与其他房产类型一样,库存相对销售的增长使市场向更平衡的状态转变,尤其是 50 万以上的联排别墅。这也减缓了房价的上行压力。3 月份市场基准价格为 $454,000 ,比去年同期高 2%,但仍比去年 6 月的峰值低近 4%。


公寓(Apartment Condominium)

第一季度结束后,与其他房产类型相比,公寓销售同比下降幅度最大。然而,去年公寓市场创下历史新高,而今年 3 月的 1,383 套销售量仍然远高于长期趋势。尽管需求相对较强,但新增房源的大幅增长导致销售与新上市房源比例降至 50% 以下,并推动库存上升。截至 3 月,公寓库存量达到 1,710 套,使供应月数上升至略高于 3 个月。虽然供应月数较过去三年的极低水平有所上升,但仍远低于 2015 年至 2020 年间的 6 个月平均水平。

尽管如此,供应的增加放缓了价格增长速度。3 月份市场基准价格为 $336,100 ,与上月持平,比去年同期高近 3%。尽管同比有所增长,价格仍低于去年 8 月创下的峰值。各个区域价格均未达到峰值,其中北区和东北区的降幅最大。

周边区域市场情况(Regional Market Facts)

Airdrie

3 月份,Airdrie共售出 160 套房屋,第一季度销售总量为 395 套,比去年同期下降 11%。销售下滑的同时,新上市房源有所增加,导致 3 月份销售与新上市房源比例降至 57%,推动库存进一步上升。去年同期,市场供应极为有限,而今年 3 月的库存量达到 398 套,远高于去年的 164 套,供应月数达到 2.5 个月,使市场向更平衡的状态转变。市场逐步摆脱卖方市场的影响,缓解了房价上涨压力。3 月份独立屋基准价格为 $651,300 ,高于上月,并比去年同期上涨超过 2%。最近的价格上涨缩小了与 2024 年 6 月峰值 $657,400 之间的差距。


Cochrane

3 月份,Cochrane的销售与去年同期保持一致。第一季度结束后,销售水平略高于去年同期,并远高于长期平均水平。新上市房源有所增加,但由于销售保持较高水平,销售与新上市房源比例仍维持在 67%,库存增长速度较其他地区有所放缓。3 月份库存量达到 213 套,高于去年同期的低水平,但与长期趋势一致。库存的改善和稳定的销售使供应月数逐步向更平衡的状态发展,尤其是相较过去四年。市场的变化放缓了房价上涨速度。3 月份独立屋基准价格达到$686,800,较上月增长,并比去年同期上涨超过 5%。尽管房价涨幅放缓,但 3 月份的价格已创下Cochrane市场的新高。


Okotoks

今年前三个月,Okotoks的房屋销售总计 129 套,低于去年同期的 155 套。新上市房源有所改善,但销售与新上市房源比例仍高于 60%,库存仍处于极低水平。3 月份,市场库存仅有 96 套,而销售量为 53 套,供应月数仍低于 2 个月,推动房价继续上涨。尽管价格增幅较去年放缓,3 月份独立屋的基准价格达到 $715,500,创下新的基准价格纪录,并比去年同期高出 5% 以上。

Read

How was $1M+ luxury real estate in Calgary - March 2025?

In March 2025, the Calgary real estate market for detached homes over $1M dollars remained active, reflecting strong buyer demand across various price segments. The sales volume, price trends, and community-specific insights indicate a dynamic market with variations in pricing and demand across different areas.


Price Range Trends

The detached home market showed varying trends across different price points:

  • $1M - $1.5M:

    • This price range saw a healthy level of activity, with many sales occurring in desirable inner-city and suburban communities.

    • Buyers in this segment were primarily move-up buyers and investors seeking premium properties in well-established neighborhoods.

    • Homes in this range generally spent a moderate number of days on the market, with well-priced and upgraded properties selling quickly.

  • $1.5M - $2M:

    • Sales in this segment remained strong, particularly in communities offering larger lot sizes and luxury finishes.

    • High-end buyers were focused on newer builds and extensively renovated properties, reflecting a preference for modern features.

    • Some properties in this range took slightly longer to sell, particularly those with unique or niche features.

  • $2M+ Market:

    • The luxury market continued to attract buyers despite higher interest rates and economic fluctuations.

    • Many homes in this bracket were custom-built estates in exclusive neighborhoods.

    • While the volume of sales was lower compared to the mid-tier markets, demand remained steady for high-end properties with premium features.


Community Market Trends

Several communities stood out in March 2025 due to increased sales activity or notable price trends:

  • Inner-City Areas (Altadore, Mount Royal, Elbow Park)

    • Continued to be in demand for their proximity to downtown and high-end amenities.

    • Buyers sought modern infill homes, leading to competitive pricing and quick sales for well-designed properties.

    • Homes in these areas generally maintained strong price points, reflecting their desirability.

  • West Calgary (Aspen Woods, West Springs, Springbank Hill)

    • Remained popular among families looking for larger homes with modern upgrades.

    • Sales activity was robust, especially for properties with upgraded interiors and premium lots.

    • Prices remained stable, with slight increases in high-demand pockets.

  • Northwest & North Calgary (Evanston, Nolan Hill, Tuscany)

    • Attracted buyers looking for value and newer homes in family-friendly areas.

    • Detached homes here were more affordable than inner-city counterparts, making them appealing to first-time and move-up buyers.

    • Prices remained stable, with strong competition for well-maintained properties.

  • South & Southeast Calgary (Mahogany, Legacy, Cranston)

    • High interest in lake communities and newer developments continued.

    • Detached homes in these areas saw consistent demand, with well-priced properties moving quickly.

    • Buyers prioritized homes with modern layouts, finished basements, and upgraded kitchens.

  • Luxury Market (Elbow Valley, Bearspaw, Britannia)

    • Sales in the ultra-luxury market were more selective, with buyers prioritizing unique architectural styles and large land parcels.

    • Prices in this segment were stable, though negotiation flexibility was evident for premium properties.


Key Takeaways

  • Sales Activity: March 2025 experienced solid sales volumes across most price points, with mid-tier homes ($1M - $1.5M) showing the most activity.

  • Days on Market: Well-priced and move-in-ready homes sold faster, while higher-priced and niche properties took longer.

  • Buyer Preferences: Modern finishes, larger lot sizes, and prime locations remained top priorities.

  • Market Stability: Prices remained strong, with certain high-demand communities seeing slight increases.

As of the end of March 2025, there were 483 active detached home listings in the Calgary market, with the majority priced above $1 million. The overall market remained stable, especially in the luxury segment ($1.5 million and above), which continued to see strong supply and demand.

Contact us for a Free Home Evaluation.

For the latest community market report, SIGNUP HERE.

Read
Data is supplied by Pillar 9™ MLS® System. Pillar 9™ is the owner of the copyright in its MLS®System. Data is deemed reliable but is not guaranteed accurate by Pillar 9™.
The trademarks MLS®, Multiple Listing Service® and the associated logos are owned by The Canadian Real Estate Association (CREA) and identify the quality of services provided by real estate professionals who are members of CREA. Used under license.