RSS

West Springs Real Estate Summary – December 2024

The West Springs real estate market maintained strong momentum in December 2024, demonstrating solid price growth and increased activity.

  • Total Residential Benchmark Price: $805,500 (8.9% Y/Y increase)

  • Detached Homes: $1,070,500 (10% Y/Y increase)

  • Semi-Detached Homes: $747,700 (10% Y/Y increase)

  • Row Homes: $495,200 (8.9% Y/Y increase)

  • Apartments: $464,500 (9.7% Y/Y increase)

Market activity remained competitive:

  • Sales: 11 transactions, a 10% Y/Y increase

  • New Listings: 19, marking a 138% increase Y/Y

  • Inventory: 27 active listings, up 145% Y/Y

  • Months of Supply: 2.45 months, showing a relatively balanced market with continued buyer interest.

2024 Annual Market Summary

West Springs experienced a strong and steady real estate market throughout 2024, with price increases across all property types and heightened sales activity.

  • Total Residential Benchmark Price (Annual Average): $814,025 (6.6% Y/Y increase)

  • Total Sales: 228 properties sold, a 12% increase from 2023

  • New Listings: 330 listings, marking a 29% rise

  • Sales-to-New-Listings Ratio: 69%, indicating a balanced market with healthy demand

  • Average Months of Supply: 1.63 months, suggesting a competitive landscape favoring sellers

  • Days on Market (DOM): 22 days, reflecting quick sales and strong demand

Property Performance in 2024:

  • Detached Homes: Prices rose 10% Y/Y to an annual average of $1,064,533.

  • Semi-Detached Homes: Increased 11% Y/Y, averaging $753,800.

  • Row Homes: Saw a 15% Y/Y growth, reaching $503,275.

  • Apartments: Experienced a 15% Y/Y increase, averaging $459,942.

Key Market Takeaways

  1. Sustained Price Growth: Property values consistently increased, driven by strong demand and limited supply.

  2. Increased Sales Activity: More transactions were completed in 2024 compared to 2023, reflecting a robust real estate environment.

  3. Balanced Market Conditions: While inventory rose significantly in the latter half of the year, demand kept the market stable.

  4. High Buyer Interest: Shorter DOM and increasing benchmark prices signal continued interest from buyers despite economic conditions.

West Springs remains a sought-after community with a thriving real estate market, making it an attractive area for both homebuyers and investors.

Read

Arbour Lake Real Estate Market Summary – December 2024

Market Trends:

  • Sales Activity:

    • Total residential sales in Arbour Lake reached 87 units, reflecting a 16% decrease compared to December 2023.

    • Detached home sales saw a 67% decline year-over-year.

    • Semi-detached and row homes recorded 44% and 140% increases, respectively, in sales volume.

  • Inventory & New Listings:

    • Active inventory was at 122 units, marking a 3% increase from last year.

    • Months of supply stood at 1.83 months, suggesting a continued seller's market.

    • New listings totaled 10 units, a 45% increase compared to December 2023.

  • Pricing Trends:

    • The benchmark price for detached homes was $706,900, a 4.5% decrease year-over-year.

    • Semi-detached homes had a benchmark price of $596,700, growing 5.8% annually.

    • Row homes reached $408,200 (an 11.2% increase), while apartment units rose 11.7% to $326,900.

    • The total residential benchmark price for Arbour Lake stood at $565,500, an 8% increase from 2023.

2024 Annual Real Estate Summary:

  • Market Performance:

    • The total residential sales for the year reached 749 transactions, a 9.9% increase compared to 2023.

    • The median home price was $715,000, up 7.7% annually.

    • The average home price in Arbour Lake stood at $750,585, reflecting a 4.1% increase from the previous year.

  • Market Trends:

    • The supply remained tight throughout 2024, keeping months of supply below 2 months for most of the year.

    • Home values experienced steady growth, especially for attached and apartment-style properties, due to strong demand and limited availability.

    • Sales-to-new-listings ratio remained above 100%, reinforcing the seller-favorable market conditions.

Looking Ahead to 2025:

  • Demand is expected to remain strong, particularly for more affordable property types like row homes and apartments.

  • Supply constraints may continue to drive price growth, but interest rate fluctuations could impact buyer activity.

  • New developments and resale home availability will be key factors in shaping the market dynamics in 2025.

Overall, Arbour Lake remained a competitive and high-demand community in 2024, showing resilience and steady price appreciation despite slight slowdowns in detached home sales.

Read

Coventry Hills Real Estate Market Report – December 2024

The Coventry Hills real estate market in December 2024 continued to showcase steady demand, closing the year on a strong note. Despite seasonal slowdowns, the market remained resilient, with stable home prices and active buyer interest.

  • Average Sale Price: The average sale price in Coventry Hills for December 2024 was $525,000, reflecting a 3% increase compared to the same period in 2023.

  • Sales Volume: A total of 28 homes were sold, representing a 10% decrease from November due to seasonal trends.

  • Days on Market (DOM): Homes spent an average of 32 days on the market, slightly longer than the previous month but within the annual average.

  • New Listings: December saw 22 new listings, contributing to a relatively tight inventory and supporting stable property values.

Market Trends & Insights

  • Steady Demand: Buyer demand persisted despite interest rate fluctuations, with well-priced homes receiving strong attention.

  • Sellers Holding Value: Limited inventory helped sellers maintain competitive pricing, preventing major price reductions.

  • Investor Interest: The rental market continued to attract investors, with steady rental yields adding to the area’s appeal.

  • Mortgage Rates & Affordability: Mortgage rate adjustments influenced buyer behavior, though Coventry Hills remained a sought-after community due to affordability and amenities.

2024 Annual Summary

The Coventry Hills real estate market experienced significant trends throughout 2024:

  • Overall Market Growth: Home values appreciated by an average of 5.2% over the year, reflecting strong buyer confidence and demand.

  • Inventory Fluctuations: The market saw periods of both high and low inventory, affecting pricing and competition.

  • Sales Performance: A total of 375 homes were sold throughout the year, with peak activity observed during the spring and early summer months.

  • Influence of Economic Conditions: Interest rate adjustments and economic factors played a role in shaping buyer affordability and investment decisions.

Looking Ahead to 2025

  • Continued Demand: Coventry Hills is expected to remain a desirable neighborhood, with strong interest from first-time homebuyers and investors.

  • Stable Prices: Home values are forecasted to hold steady, barring any major economic shifts.

  • Potential Inventory Increase: A rise in new listings could balance the market and provide more opportunities for buyers.

Read

Tuscany Real Estate Market Summary – December 2024

Market Trends

Detached Homes

  • Sales: 6 units (-14% YoY)

  • Benchmark Price: $782,700 (+10% YoY)

  • Inventory: 7 units (+17% YoY)

  • Months of Supply: 1.18 months

Detached homes remained in high demand, with a significant price increase. However, sales dropped slightly compared to last year, likely due to limited inventory.

Semi-Detached Homes

  • Sales: 1 unit (No YoY change)

  • Benchmark Price: Not available

  • Inventory: 0 units (-100% YoY)

Semi-detached homes had minimal market activity, reflecting a lack of available listings.

Row Homes (Townhouses)

  • Sales: 1 unit (No YoY change)

  • Benchmark Price: $480,800 (+10.7% YoY)

  • Inventory: 2 units (No change YoY)

  • Months of Supply: 2 months

Row homes experienced stable sales and inventory levels, with moderate price growth.

Apartments

  • Sales: 3 units (+200% YoY)

  • Benchmark Price: $417,500 (+8.9% YoY)

  • Inventory: 2 units (+100% YoY)

  • Months of Supply: 0.67 months

Apartment sales saw a sharp increase, supported by higher demand. Prices appreciated as inventory remained relatively low.

Overall Market Performance

  • Total Residential Sales: 11 units (+10% YoY)

  • New Listings: 11 (+10% YoY)

  • Benchmark Price: $703,200 (+7% YoY)

  • Months of Supply: 1.45 months (+220% YoY)

Tuscany’s market showed steady sales growth and price appreciation, though inventory levels increased compared to last year, which could lead to more balanced conditions.


2024 Annual Summary

Market Overview

  • Total Residential Sales: 267 (-6% YoY)

  • New Listings: 318 (-4% YoY)

  • Benchmark Price: $699,608 (+10.9% YoY)

Despite a slight decrease in total sales, Tuscany’s real estate market experienced strong price growth in 2024, particularly for detached homes and townhouses.

Key Trends in 2024

  1. Price Growth Across All Property Types

    • The benchmark price rose nearly 11%, with detached homes seeing the highest appreciation.

  2. Limited Inventory Led to a Competitive Market

    • Low inventory levels kept the market competitive, with homes selling close to the listing price.

  3. Shift in Apartment Demand

    • While apartments had slower activity earlier in the year, demand picked up towards the end of 2024, driving price increases.

  4. Sustained Interest in Townhouses

    • Townhomes remained a preferred option for buyers looking for affordability and space.

Read

2024 marks another strong year for sales and price growth

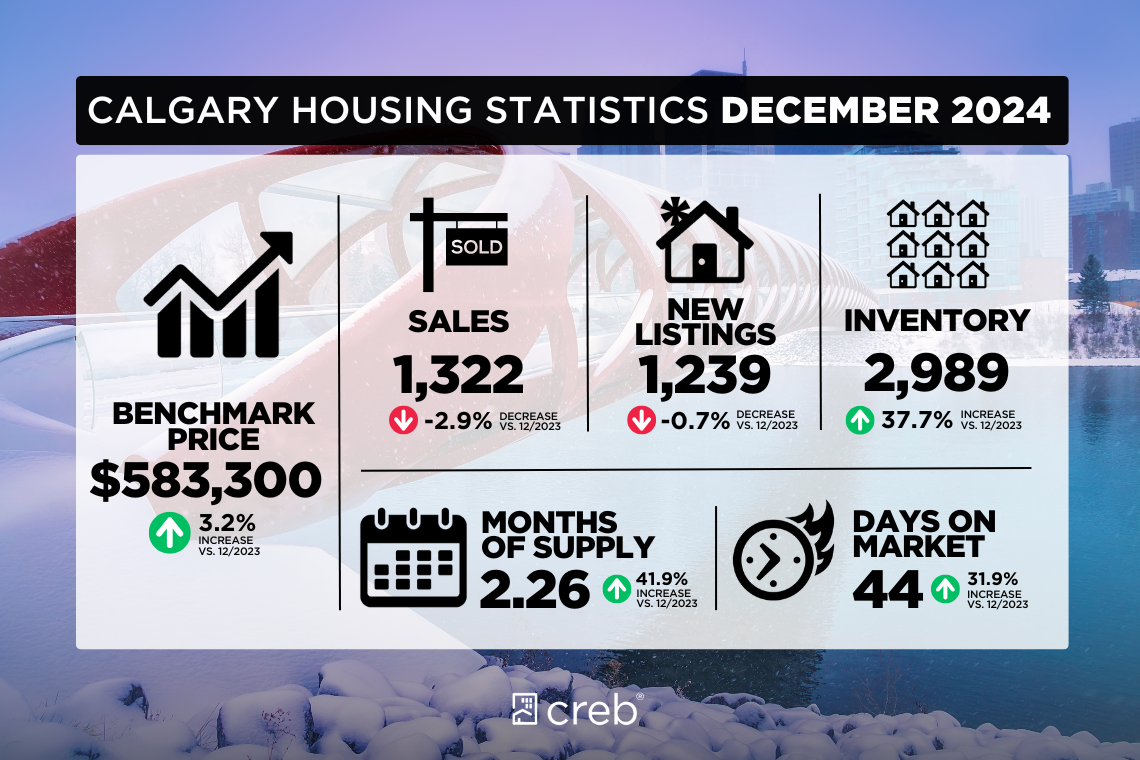
Calgary, January 2, 2025 – The year ended with 1,322 sales in December, a three per cent decline over last year. But nearly 20 per cent higher than long-term trends. Overall sales in 2024 were just shy of last year’s levels, as gains for higher-priced homes offset pullbacks in the lower price ranges caused by supply challenges.

“Population gains over the past several years have supported sales activity that has outperformed long-term trends. In 2024, sales would likely have been higher if there was more supply choice, especially in the lower price ranges,” said Ann-Marie Lurie, Chief Economist at CREB®. “That being said, we did start to see shifts occurring in the market in the second half of the year as supply levels started to improve for higher priced homes.”

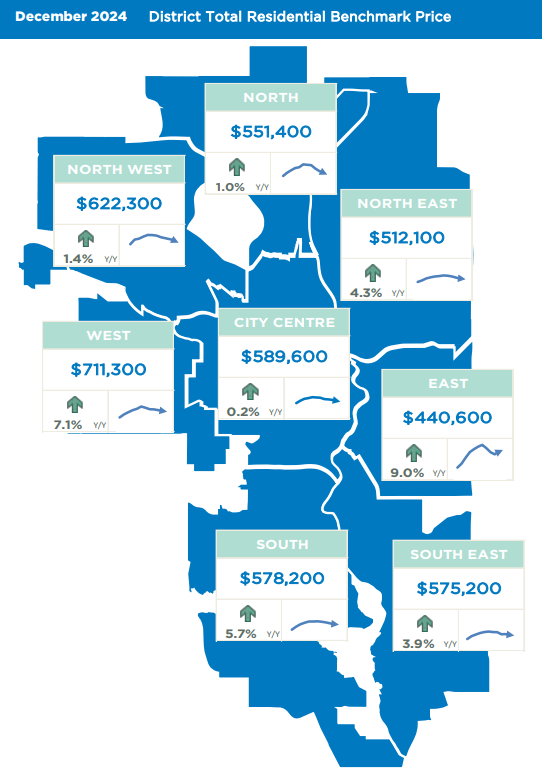
As of December, there were 2,989 units available in inventory, still below long-term trends for the month but a significant improvement over the lower levels reported last December and levels reported early this year. Improved rental choice and significant gains in new home activity helped boost new listings in the resale market, driving higher inventories in the year's second half. While conditions vary depending on price range and property type, more housing options have helped to take some of the pressure off home prices, which stabilized in the second half of the year following steep gains in the spring. Overall, on an annual basis, total residential benchmark prices improved by over seven per cent.

SALES 1,322 2.9% Y/Y As we move into 2025, supply will continue to be a dominant theme. However, how they impact prices will ultimately depend on the type of supply being added and how demand holds up in the face of a changing economic climate. On January 21, CREB® will release its forecast report, highlighting the expectations and risks facing the market in the coming year.

Detached

Easing lending rates have likely supported some recent year-over year gains in detached home sales over the past three months. Improving sales were driven by gains for homes over $600,000, which also reported improvements in new listings. Inventory levels did improve within city limits for detached homes; however, conditions varied across districts. The City Centre, North East and North District all reported relatively balanced conditions over the last quarter of the year, while all other districts continued to struggle with seller market conditions. The relatively tight market conditions throughout the year caused prices to rise by nearly eleven per cent in 2024, a faster pace than what was reported in 2023. Much of that growth occurred during spring when supply levels were exceptionally low. Prices grew across all districts, with the strongest growth occurring in the most affordable districts of the North East and East.

Semi-Detached

Limited supply choice for lower priced detached homes drove many purchasers toward the semi detached sector. In 2024, there were 2,355 sales, with an annual gain of five per cent. Thanks to gains in new listings relative to sales, inventory levels started to improve, supporting a shift toward more balanced conditions by the fourth quarter. However, much of this shift occurred in the higher priced City Centre district, where the months of supply averaged three months in the last quarter. The annual average benchmark price increased by nearly 11 per cent to $669,042 in 2024. Like detached homes, exceptionally tight conditions throughout the spring caused the pace of price growth to rise over the seven per cent annual gain reported in 2023. Prices improved across all districts, ranging from an annual gain of under 10 per cent in the City Centre and West to gains exceeding 15 per cent in the North East and East districts.

Row

In 2024, there were 4,647 row home sales, a gain of over two per cent compared to last year and the second-highest total on record. The growth in sales was possible thanks to the 18 per cent gain in new listings, most of which occurred for homes priced above $400,000—the gains in new listings relative to sales supported inventory growth in 2024.

By the year's end, supply improvements helped take the pressure off home prices. However, the annual benchmark price rose by 14 per cent as conditions favoured the seller throughout the year. Prices rose across all districts in the city, with the gains ranging from a low of 12 per cent in the city centre to over 20 per cent in the most affordable districts in the North East and East.

Apartment

Easing sales in the second half of the year offset earlier gains, causing apartment sales to slow by four per cent compared to last year. However, last year was a record high for sales, and the 7,568 transactions this year reflect the second-highest year on record. At the same time, new listings have been on the rise, supporting inventory gains and a shift toward more balanced conditions by the end of the year. As more supply became available, we did see some price adjustments in the last quarter of the year. However, the quarterly decline did not offset the strong gains that occurred earlier in the year, and the annual benchmark price rose by 15 per cent. Price growth ranged from a low of 11 per cent in the city centre to over twenty per cent in the North East, East and South districts.

Read

McKenzie Towne Real Estate Market Report – December 2024


McKenzie Towne continues to attract buyers with its charming community feel and desirable amenities. In December 2024, the benchmark residential price reached $492,300, marking a 4.8% year-over-year increase, reflecting steady demand and value retention in this neighborhood.

A total of 10 residential properties were sold this month, while only 5 new listings were added, keeping inventory low and maintaining a competitive market environment. Detached homes had a benchmark price of $637,000, semi-detached homes averaged $473,900, row houses were at $426,400, and apartments at $331,700. With 2.6 months of supply, the market leans toward sellers, ensuring continued price stability.

Shopping and Amenities
McKenzie Towne is well-known for its convenient access to retail and services. The High Street shopping district offers a mix of local boutiques, grocery stores, cafes, and restaurants, making daily errands and weekend outings effortless. The area also benefits from proximity to major retail hubs like South Trail Crossing, ensuring residents have access to everything from big-box stores to specialty shops.

Schools and Education
For families, McKenzie Towne is an ideal choice, thanks to its proximity to top-rated schools. The community features elementary and junior high schools such as McKenzie Towne School and St. Albert the Great School, with access to excellent high schools nearby. These institutions provide strong academic and extracurricular programs, catering to diverse student needs.

Market Outlook
With rising home values, limited inventory, and a desirable community atmosphere, McKenzie Towne is poised to remain a sought-after location in Calgary’s real estate market. Buyers and investors looking for long-term value will find this neighborhood an excellent choice.

Read

又是一个强势年度 - 价格、交易量起升

卡尔加里2024年12月份的总住宅价格达到了$583,300,比上一年同期增长了3.2%。库存方面呈现明显的上升趋势,租赁市场的表现同样强劲,租金水平较去年同期有所提高。

销售与供应:12月库存为2,989套,比去年同期增长37.7%,但仍低于长期趋势。新增挂牌量为1,239套,同比下降0.7%。供应的增加缓解了春季价格上涨的压力,市场进入更加平稳的阶段。

价格趋势:12月总住宅基准价格为583,300加元,同比上涨3.2%。全年平均基准价格增长超过7%,其中独立屋和公寓涨幅尤为显著。

从不同区域的住宅基准价格地图可以看出,西北部地区以697,333加元的价格成为最热门的投资区域之一,同比增长率达到了1.4%。相比之下,城市中心地带的增长相对缓慢,仅为0.2%,但其房价仍保持在较高水平。对于买家而言,高收入家庭更倾向于选择市中心及周边优质地段的房产;而首次购房者则可能更多地关注郊区或新兴社区的新建住宅。

Detached -独立屋

较低的贷款利率可能支持了过去三个月独立屋销售同比增长的部分原因。销售的改善主要得益于价格超过60万加元的房屋,其新增挂牌量也有所增加。

在市区范围内,独立屋的库存水平有所改善;然而,各区的市场状况有所不同。市中心、东北区和北区在过去一个季度报告了相对平衡的市场状况,而其他地区仍然面临卖方市场的挑战。

全年相对紧张的市场条件导致2024年价格上涨近11%,这一增速快于2023年。大部分涨幅发生在春季,当时供应水平异常低迷。所有地区的房价均有所上涨,其中东北区和东区这些最具可负担性的地区的涨幅最为显著。

Semi-Detached-半独立屋

低价位独立屋供应选择的有限,促使许多购房者转向半独立屋市场。2024年,半独立屋销量达到2,355套,同比增加5%。由于新增挂牌量相较销售量有所增长,库存水平开始改善,使市场在第四季度向更加平衡的状态发展。然而,这种变化主要发生在高价位的市中心地区,第四季度的平均供应月数为三个月。

2024年,半独立屋的年平均基准价格上涨近11%,达到669,042加元。与独立屋类似,春季异常紧张的市场条件推动了价格增速,超过了2023年7%的年涨幅。各地区的价格均有所提升,涨幅从市中心和西区不到10%到东北区和东区超过15%不等。

Row-排屋

2024年,共售出4,647套排屋,同比增加超过2%,为历史第二高销售总量。销售增长得益于新增挂牌量的18%增长,其中大部分新增挂牌价格在40万加元以上。新增挂牌量相较销售量的增加支持了2024年库存的增长。

到年底,供应的改善减轻了房价的压力。然而,由于全年市场状况对卖方有利,年度基准价格仍上涨了14%。全市各区的价格均有所上升,从市中心最低的12%涨幅到东北区和东区这些最具可负担性的地区超过20%的涨幅不等。

Apartment Condominium-共管公寓

下半年销售的放缓抵消了年初的增长,使公寓销售量同比下降4%。然而,去年创下了历史最高销售纪录,而今年的7,568宗交易仍是历史第二高水平。同时,新增挂牌量有所增加,支持了库存的增长,并在年底推动市场向更加平衡的状态发展。

随着供应的增加,年末季度出现了一些价格调整。然而,这一季度的下降并未抵消年初的强劲增长,年度基准价格仍上涨了15%。价格涨幅从市中心最低的11%到东北区、东区和南区超过20%不等。

更多卡尔加里房地产资讯,请查看链接

Read

Mahogany Real Estate Market Summary - December 2024

Market Performance:

  1. Overall Market Trends:

    • The benchmark price for residential properties in Mahogany reached $583,400, a 2.7% year-over-year increase.

    • Average prices saw significant growth, reaching $883,716, reflecting a 31.0% increase.

  2. Sales Activity:

    • 19 residential sales were recorded, a 44% decrease from December 2023.

    • Inventory increased by 20%, totaling 60 active listings.

    • The months of supply rose to 3.16, suggesting a slight shift toward a balanced market.

  3. Property Types:

    • Detached Homes: Benchmark price at $809,400, an 8% increase year-over-year.

    • Semi-Detached Homes: Benchmark price at $569,700, a 9% growth.

    • Row Homes: Benchmark price at $485,500, up 5.8%.

    • Apartments: Benchmark price at $357,500, showing steady demand with a 2.7% increase.

  4. New Listings:

    • 20 new listings entered the market in December, a 44% decrease compared to the previous year.

Community Developments:

  • Community Expansion:

    • Mahogany continues to grow with new residential projects that include both luxury lakefront properties and affordable housing options, providing a diverse range of living styles.

  • Lake and Recreational Facilities:

    • The community's 63-acre lake, the largest in Calgary, remains a focal point, offering year-round activities like skating, fishing, and swimming. New lake amenities, such as expanded dock spaces and updated equipment rentals, enhance the outdoor lifestyle.

  • Infrastructure Enhancements:

    • Improved road networks and expanded transit options make commuting easier for residents. Plans are underway to further enhance connectivity within and beyond Mahogany.

  • Retail and Dining Hub:

    • Mahogany Village Market continues to thrive, featuring new dining, shopping, and entertainment venues. This adds to the vibrant, urban feel of the community.

  • Education and Family-Oriented Developments:

    • New school projects and expansions of recreational facilities, including playgrounds and sports fields, reflect Mahogany's focus on family-friendly living.

Read

Seton Real Estate Market Report - December 2024

Market Highlights:

  1. Overall Market Performance:

    • The benchmark price for residential properties in Seton stood at $470,600, showing a 5.3% year-over-year increase.

    • The average price of properties reached $466,070, up 2.2% compared to December 2023.

  2. Sales and Inventory:

    • 23 residential sales were recorded in December, a 10% year-over-year increase.

    • Inventory levels increased by 48%, reaching 62 active listings.

    • The months of supply rose to 2.70, reflecting a slightly balanced market.

  3. Property Types and Prices:

    • Detached Homes: Benchmark price at $761,000, with a 9.5% year-over-year rise.

    • Semi-Detached Homes: Benchmark price at $584,600, stable performance.

    • Row Homes: Benchmark price at $465,800, reflecting a 5.7% increase.

    • Apartments: Benchmark price at $376,900, up 5.2%.

  4. New Listings:

    • A total of 24 new listings entered the market in December, representing a 4% year-over-year increase.

Community Features:

  • Modern Urban Lifestyle: Seton is known as Calgary's "urban district," offering a blend of residential, retail, and commercial spaces.

  • Amenities: Home to the largest YMCA in the world, a state-of-the-art Cineplex, and the South Health Campus, Seton offers unparalleled convenience.

  • Walkability: Designed with walkable streetscapes, the community features parks, green spaces, and pathways connecting residents to amenities.

  • Access to Transit: Excellent connectivity through major roadways and public transit options, making it easy for residents to navigate the city.

Read

Auburn Bay Real Estate Market - December 2024

Market Highlights:

  1. Total Residential Prices:

    • The benchmark price for residential properties in Auburn Bay reached $626,900, marking a 2.1% year-over-year increase.

    • Average property prices were up by 22.7%, reaching $681,500.

  2. Sales and Inventory:

    • 18 sales were recorded in December 2024, reflecting a 6% increase compared to December 2023.

    • Inventory levels rose by 65%, totaling 28 properties available for sale.

    • The months of supply increased to 1.56, indicating a slight cooling but still favorable market conditions for sellers.

  3. Property Types:

    • Detached Homes: Benchmark price at $802,700, up 5.9% year-over-year.

    • Semi-Detached Homes: Benchmark price at $522,000, showing steady demand.

    • Row and Apartment Properties: Prices remained competitive, with apartments at a benchmark of $365,200.

  4. New Listings:

    • A total of 16 new listings entered the market, a 33% increase compared to the same month last year.

Community Features:

  • Lifestyle and Amenities: Auburn Bay is a family-friendly community centered around a stunning 43-acre lake, offering year-round recreational activities such as swimming, fishing, and skating.

  • Green Spaces and Trails: The neighborhood boasts extensive parks, playgrounds, and pathways connecting residents to nature.

  • Accessibility: Convenient access to schools, shopping centers like Seton Urban District, and major roads makes Auburn Bay a desirable location.

  • Health and Wellness: The community is close to the South Health Campus, ensuring top-notch healthcare access for residents.

Contact us for a Free Home Evaluation.

For latest community market report, SIGNUP HERE.

Read

Varsity Real Estate Market Summary – December 2024 & 2024 Annual Summary

Market Overview

The Varsity real estate market in December 2024 saw strong year-over-year growth in sales, with 13 total transactions, marking a 117% increase compared to December 2023. However, new listings declined by 30%, resulting in lower inventory levels. This led to an increase in months of supply to 1.62, indicating a slight shift towards a more balanced market.

The benchmark price for total residential properties was $544,600, reflecting a 3.6% decline year-over-year.

Market Trends by Property Type

  • Detached Homes: The benchmark price for detached homes stood at $882,400, down 4% year-over-year. Sales increased by 100%, but inventory remained low, which may continue to put upward pressure on prices in the coming months.

  • Semi-Detached Homes: There were no recorded sales of semi-detached homes in December 2024, indicating limited activity in this segment.

  • Row/Townhouses: Row homes had one sale, with a benchmark price of $501,200, reflecting a 5.6% year-over-year increase.

  • Apartments: Apartment sales saw a significant increase of 200%, with six units sold. The benchmark price for apartments reached $273,800, up 0.4% year-over-year.

2024 Annual Market Summary

The Varsity real estate market in 2024 showed moderate growth, with total annual sales reaching 266 transactions, a 7% increase from 2023. New listings rose by 22%, bringing more inventory into the market.

  • The benchmark price for total residential properties increased by 5.1%, reaching $572,400.

  • Detached homes saw a moderate decline in price but continued to be in demand, especially in higher price segments.

  • Row homes and apartments remained popular among buyers, with steady price appreciation and increased transactions.

Read

Calgary Harvest Hills Real Estate Market – December 2024

Market Overview

  • Total Sales: 10 homes sold, marking a 43% increase from December 2023.

  • New Listings: 11 new listings, a 267% increase from last year.

  • Inventory: 14 active listings, up 250% year-over-year.

  • Benchmark Price: $536,100, reflecting a 0.6% annual increase.

  • Months of Supply: 1.40 months, indicating a continued seller’s market.


Market Breakdown by Property Type

Detached Homes

  • Sales: 6 homes sold, a 20% increase year-over-year.

  • New Listings: 4 new detached home listings (+100% Y/Y).

  • Benchmark Price: $616,100, showing a 2.4% increase from last year.

  • Market Trend: Detached homes remain in demand, with a rise in new listings and moderate price appreciation.

Semi-Detached Homes

  • Sales: 0 sales recorded in December.

  • New Listings: 0 new listings.

  • Benchmark Price: N/A (No activity in this segment).

  • Market Trend: Limited supply and demand in this category.

Row (Townhouses)

  • Sales: 0 units sold, a 100% decline compared to last year.

  • New Listings: 2 new listings, showing a 100% increase.

  • Benchmark Price: $430,900, a 3.0% increase from last year.

  • Market Trend: Townhouse sales were inactive this month, but prices have continued to rise.

Apartments

  • Sales: 4 apartment sales, no year-over-year comparison available.

  • New Listings: 5 new listings, up 100% from last year.

  • Benchmark Price: $410,000, reflecting a 145% price increase.

  • Market Trend: Apartments continue to be an attractive option, with strong price growth and an increase in new listings.


Harvest Hills 2024 Annual Market Summary

Overall Market Trends

  • Total Sales for 2024: 132 homes sold, a 4% decrease from 2023.

  • Total New Listings for 2024: 182 new listings, reflecting a 14% increase from 2023.

  • Average Months of Supply for 2024: 1.32 months, a 68% increase from the previous year.

  • Annual Benchmark Price: $550,717, marking a 9.1% increase year-over-year.

  • Median Home Price: $537,500, increasing 4.6% annually.

  • Average Home Price: $539,231, up 8.4% compared to last year.


Annual Breakdown by Property Type

Detached Homes (2024)

  • Total Sales: 64 homes, down 16% from 2023.

  • Total Listings: 83 new listings, a 7% decline.

  • Benchmark Price: $616,100, up 2.4% from last year.

  • Market Trend: While sales slowed slightly, detached home prices continued to rise due to steady demand.

Semi-Detached Homes (2024)

  • Total Sales: 6 homes, a 25% decrease year-over-year.

  • Total Listings: 10 new listings, up 43%.

  • Benchmark Price: N/A (Due to limited transactions).

  • Market Trend: Minimal activity, but inventory increased.

Row Homes (Townhouses) (2024)

  • Total Sales: 21 homes, down 13% from 2023.

  • Total Listings: 28 new listings, up 12%.

  • Benchmark Price: $430,900, a 3.0% increase from last year.

  • Market Trend: Demand slightly weakened, but townhouse prices continued to rise.

Apartments (2024)

  • Total Sales: 41 apartments, a 37% increase compared to last year.

  • Total Listings: 61 new listings, up 61%.

  • Benchmark Price: $410,000, a 145% price surge.

  • Market Trend: Apartments were the fastest-growing segment, with significant price growth and rising inventory.

Read
Data is supplied by Pillar 9™ MLS® System. Pillar 9™ is the owner of the copyright in its MLS®System. Data is deemed reliable but is not guaranteed accurate by Pillar 9™.
The trademarks MLS®, Multiple Listing Service® and the associated logos are owned by The Canadian Real Estate Association (CREA) and identify the quality of services provided by real estate professionals who are members of CREA. Used under license.